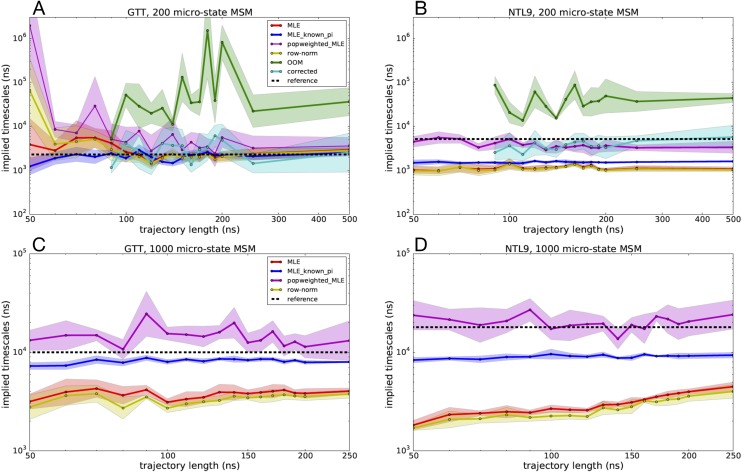
FIG. 7.
Slowest implied time scales predicted by various MSM estimators as a function of seeding trajectory length, where five independent trajectories were started from each microstate. Estimated slowest time scales are shown for 200-microstate MSMs of (a) GTT WW domain and (b) K12M NTL9(1–39) and for 1000-microstate MSMs of (c) GTT WW domain and (d) K12M NTL9(1–39). Uncertainties were computed using a bootstrap procedure.

