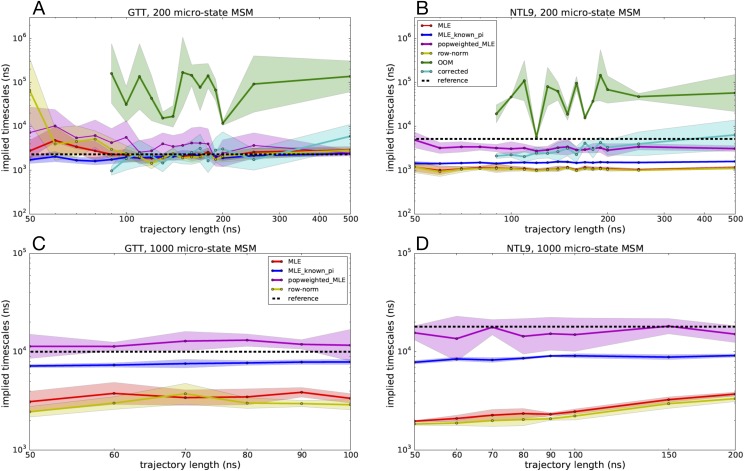
FIG. 8.
Slowest implied time scales predicted by various MSM estimators as a function of seeding trajectory length, where ten independent trajectories were started from each microstate. Estimated slowest time scales are shown for 200-microstate MSMs of (a) GTT WW domain and (b) K12M NTL9(1–39) and for 1000-microstate MSMs of (c) GTT WW domain and (d) K12M NTL9(1–39). Trajectory lengths longer than 100 ns for GTT WW domain and 200 ns for K12M NTL9(1–39) result in trajectory data sets larger than the reference model and are not shown. Uncertainties were computed using a bootstrap procedure.

