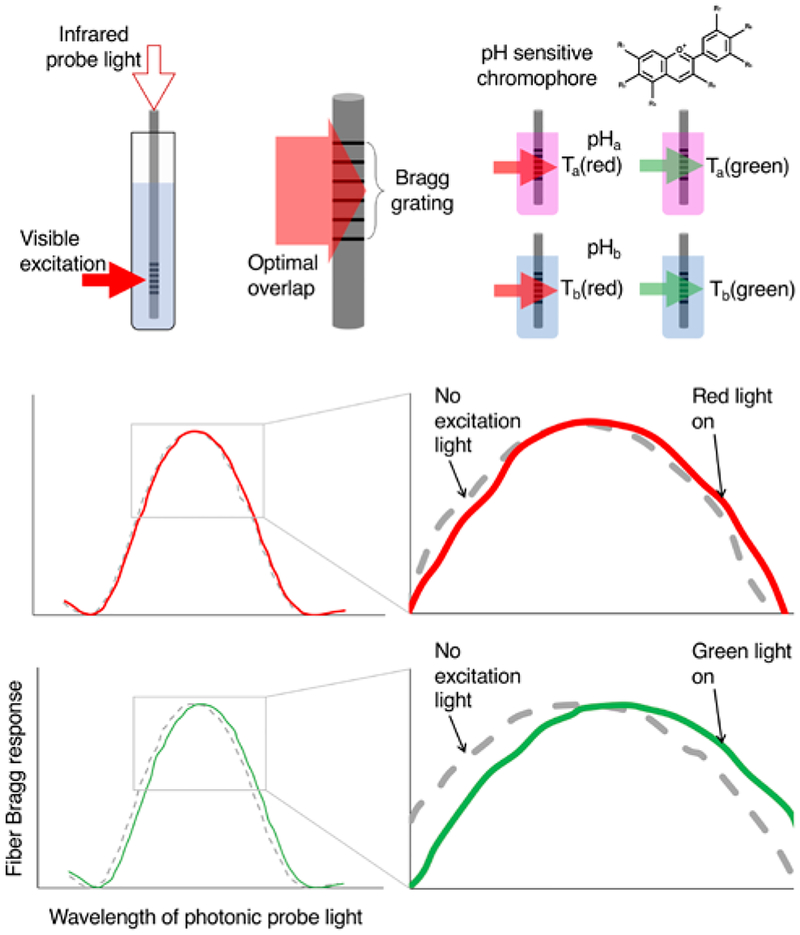
Figure 1.
Schematic outline of measurement protocol. Top left: FBG sensor placed into a chromophore solution. The sensor is interrogated with infrared light while the chromophore is excited with visible light. Top middle: To maximize the observed signal, the excitation light optimally overlaps the FBG sensor. Top right: The anthocyanin chromophores (from RCP), which take on different colors over a range of pH values, are expected to have differential temperature response based on the color of excitation light and their absorption coefficients for that light at the given pH. Middle and bottom: Examples of FBG response to increases in temperature due to photoexcitation from red (middle) and green (bottom) light.

