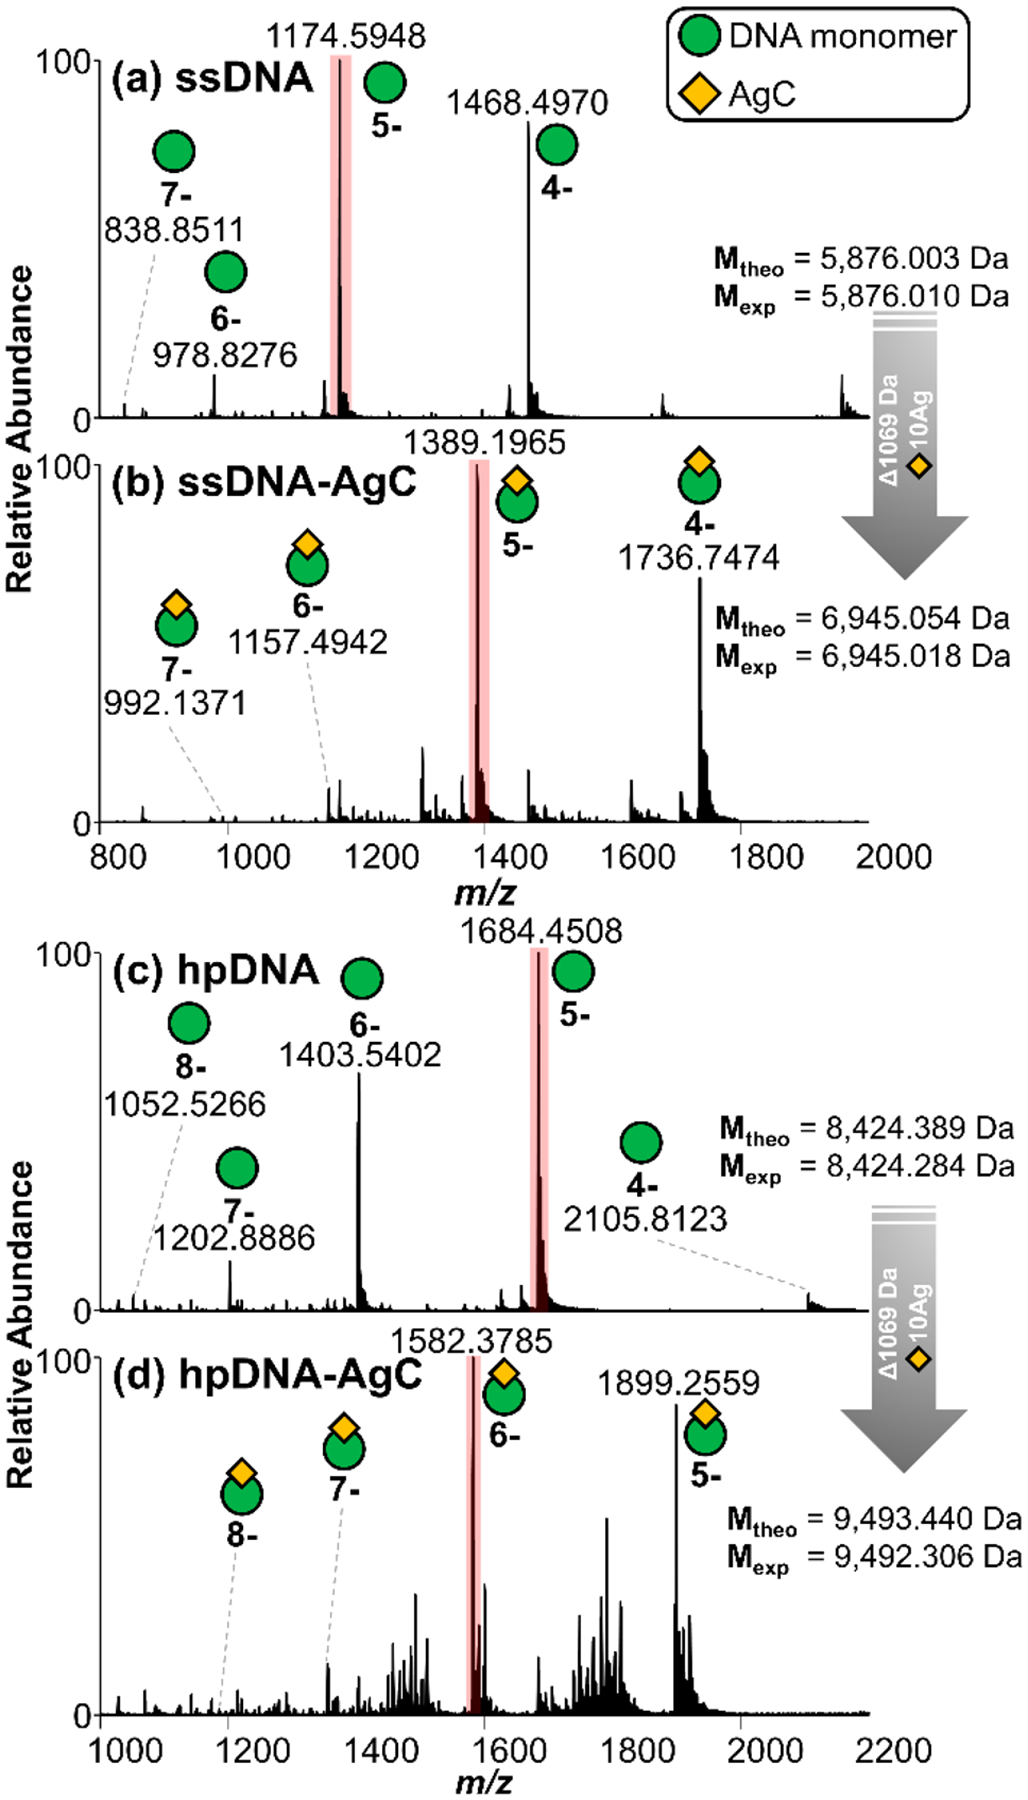
Figure 1.

Negative-mode MS1 spectra of ssDNA CCC CAA CTC CTT CCC GCC AC in 50 mM ammonium acetate (a) without and (b) with the AgC and hpDNA CCC CAA CTC CTT CCC GCC TTT TGG CGG G (c) without and (d) with the AgC. The most abundant charge states for each sample are highlighted in pink, and theoretical and experimental values of DNA and DNA-AgC are included, enabling determination of DNA-AgC stoichiometry.
