FIGURE 3.

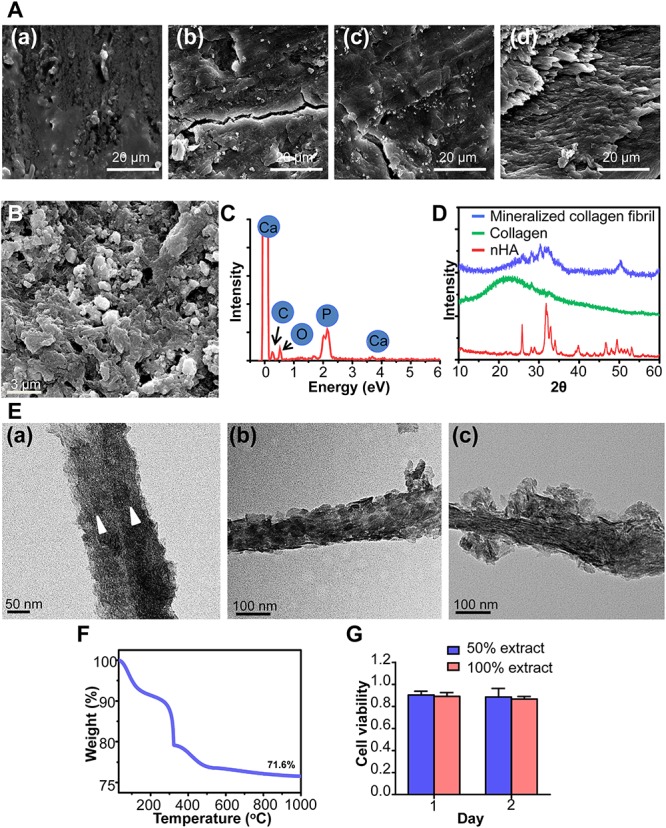
The characterization of antigen-extracted mineralized collagen fibril. (A) The SEM image of bone during the process. (a) Fresh bone, bone subjected to the first methanol and chloroform process (b), hydrogen peroxide process (c), and second methanol and chloroform process (d). (B) The SEM and (C) EDX spectrum of mineralized collagen fibril. (D) The XRD spectra. (E) Representative TEM images of mineralized collagen fibril. The triangles in (a) indicated the individual mineralized collagen fibrils merged into coarse bundle, the face-on (b) and edge-on (c) view of nHA in mineralized collagen fibril. (F) The TGA result of mineralized collagen fibril following combusted to 1000°C in the air. (G) The different concentrations of extract of mineralized collagen fibril on the viability of MG63 cell (n = 4, experiments performed in triplicate. The bars show the mean ± SD).
