FIGURE 4.
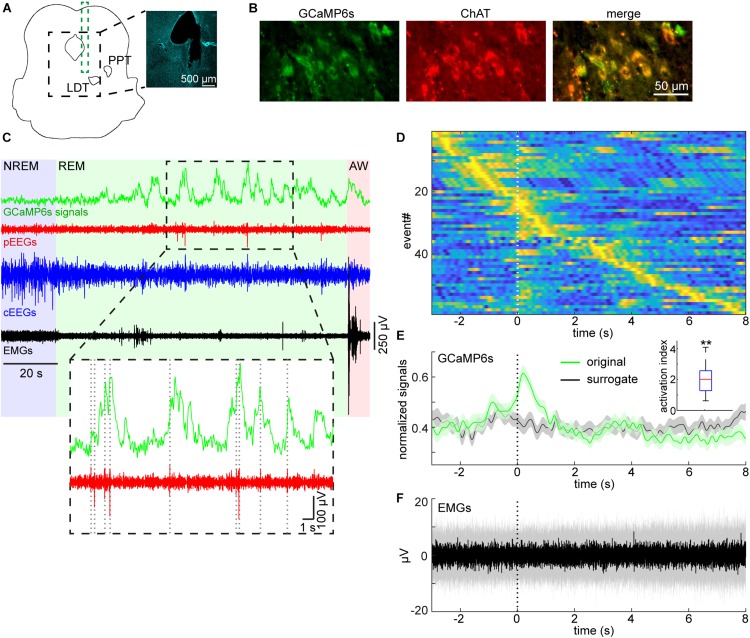
Pontine waves and mesopontine cholinergic activity during REM sleep. (A) Histological analysis of the position of an implanted optrode. The photograph is a DAPI stained image. LDT, laterodorsal tegmental nucleus. PPT, pedunculopontine tegmental nucleus. (B) Expression patterns of GCaMP6s and ChAT. (C) Example GCaMP6s, pontine EEGs (pEEGs), cortical EEGs (cEEGs), and EMGs signals around a REM sleep episode. Inset, pontine waves (spiking events in pEEGs) often co-occurred with large activity of calcium signals. (D) GCaMP6s signals triggered by detected P-waves. Time zero indicates the onset of pontine waves (P-waves) during REM sleep. GCaMP6s signals were normalized by the maximum value of each trace and all traces were sorted by the peak timing of GCaMP6s signals. (E) The mean profile of calcium signals triggered by detected P-waves. The normalized signals in (D) were averaged (green). In the surrogate condition (black), the timing of P-waves were randomly assigned during each REM sleep episode whilst still conserving the number of P-waves during the episode. Then the averaged calcium signals were computed. Errors, SEM. Inset, activation index in 1-s window from the onset of P-waves. **p < 0.01 (t-test). (F) The median profile of EMG signals triggered by detected P-waves. Shaded area, 25–75 percentile.

