Figure 2.
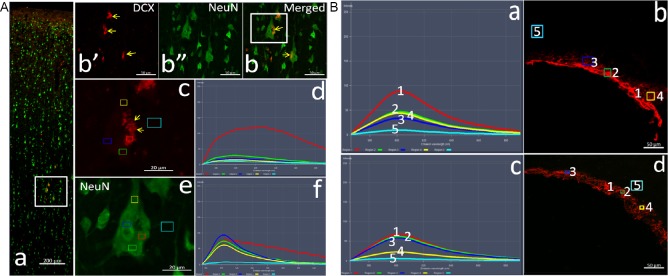
Changes in DCX labeling and emission spectra of the adjacent sections after antibody tissue adsorption.
(A) Staining and spectral pattern in the cerebral neocortex. The adjacent sections from the cortex and subventricular zone of the adult macaque were immunolabeled with the tissue-adsorbed DCX antibody (Ab18723-1) and fluorescein-conjugated secondary antibody (11036, Thermo Fisher Scientific) (red). NeuN is labeled green. In panels A-a, the low magnification pictures of the cortex show its hierarchical structure. Panels A-b’-b are the high magnification images of the region in the white frame in panel a, showing the DCX-positive neurons and the localization of the autofluorescent clusters (yellow arrows) with NeuN in the perikaryon. Images A-c and e are higher magnifications of the region in the white box in panel A-b, and color boxes represent the test sites of the spectrum. Panels A-d and f are the emission spectra taken from different sites (color frames) on the perikarya and background of images respectively, for excitation wavelengths of 561 nm (A-c and -d) and 488 nm (A-e and -f). Scale bars: 200 µm in panel A-a, 50 µm in A-b, and 20 µm in panels A-c and -e. (B) Changes in DCX labeling and the emission spectra after tissue adsorption in the subventricular zone. Panels show the emission spectra from the subventricular zone using unadsorbed (a and b) and tissue-adsorbed (c and d) antibodies for an excitation wavelength of 561 nm. Numbers in B-a and B-c correspond to those in graphs B-b and B-d, respectively. Scale bars: 50 µm in B-b and -d. DCX: Doublecortin; Lv: lateral ventricles.

