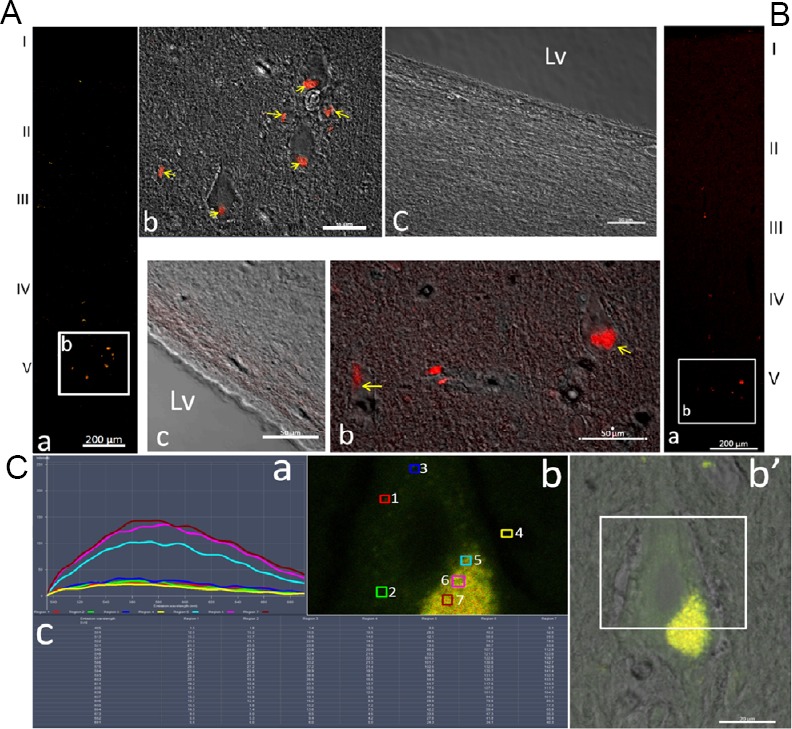
Figure 5.

Autofluorescence in neurons of the cerebral cortex of the adult macaque.
(A) Adjacent cryostat sections of the adult macaque cortex were mounted with a cover glass directly and immediately after slicing, without any other treatment (a–c, upper left). Panel A-a shows the localization of the autofluorescent particles in the low magnification image. Panel A-b is the merged high magnification image from confocal and phase contrast microscopy from the white frame in panel a, showing the localization of the autofluorescent particles (yellow arrows) in the neuron in lamina V. Panel A-c is the merged high magnification image from laser confocal and phase contrast microscopy of the subventricular zone, and no autofluorescent particles were found in this area. (B) Adjacent sections incubated with the serum diluents without any primary or secondary antibody (a–c, low upper). Panel a is the low magnification image of the cortex, showing the autofluorescent clusters and particles in the cortex. The merged high magnification image from laser confocal and phase contrast microscopy (b) is the magnified image of the white frame in panel a to show the localization of the autofluorescent particles (yellow arrows) within the neurons of lamina V. Panel c is another merged image of confocal and phase contrast images of the subventricular zone without any autofluorescence. Scale bars: 200 µm in panels A-a and B-a; 50 µm in panel A-b, -c and B-b, -c. (C) Autofluorescence intensity and emission wavelength of a pyramidal cell in layer V of the adult monkey cortex (a, b and b’, c): The adjacent cryostat sections were mounted with a cover glass directly and immediately after slicing, without any other treatment. When excited at 488 nm, the wavelength and intensity (a and c) of the emission spectra of the fluorescence points (b) were measured using a laser scanning confocal microscope. Scale bars: 20 µm in C-b and -b’. The numbers next to the small boxes in different colors represent the location and order of the fluorescent dots. 1–3: The background fluorescence within the cytoplasm of the neuron; 4: background fluorescence; 5–7: fluorescence at different positions of the autofluorescent cluster. The color of the fluorescence corresponds to the color of the detection sites (boxes). (b’) The merged images of the laser scanning confocal (autofluorescence) and phase contrast microscope. The tested region in the pyramidal neuron in layer V of the cortex is indicated in the white frame. (c) The intensity of the detected fluorescence wavelength of the different test points. Lv: Lateral ventricle.
