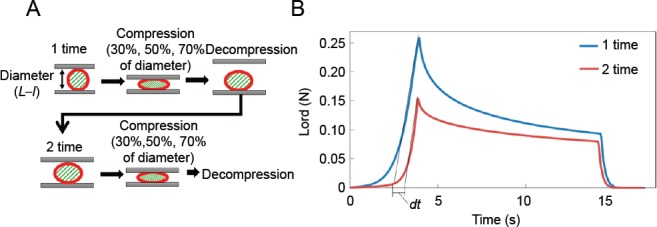
Figure 4.

Compression analysis.
(A) 1) The sample was dried off to eliminate all moisture and placed on the base. 2) The sample diameter (L–l) was measured with a transmissive laser sensor and the height of the compression plate was adjusted to the sample diameter. 3) The compression plate was lowered at a velocity of 0.2 mm⁄s to compress 30%, 50%, 70% of diameter of the sample respectively. 4) The plate was allowed to stay in position for about 10 seconds while the sample was being compressed. 5) The compression plate was raised at a velocity of 0.2 mm⁄s up to the height corresponding to the sample diameter. 6) After approximately 15 seconds, steps 3–5 were repeated once again on the same sample to ensure compression-induced injury. 7) After the second compression, the sample diameter was measured again with the transmissive laser sensor. (B) The collapse rate Cd[%] was calculated from the difference in the positions at which the load increase occurred in the time-load relationship. The time difference between the intersection of each approximate line and the time axis was calculated as dt[s].
