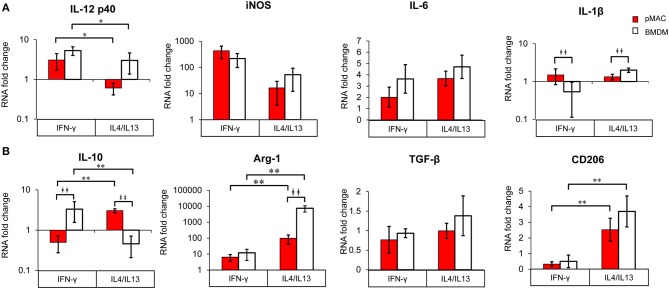
Figure 8.
BMDM and pMACs respond differently to polarization; relative gene expression. BMDM (white bars) and pMACs (red bars) were polarized with IFN-γ or IL-4/IL-13 as in Figure 7. RNA was extracted and subjected to qRT-PCR for the indicated genes. Expression for each gene was normalized to β-actin (ΔCt) and the RNA fold change determined using the ΔΔCt method (ΔCt gene after polarization-ΔCt M0 control). Genes are loosely grouped into M1 (A) and M2 (B) markers. After logarithmic transformation, the data were analyzed and statistical significance determined by linear regression. Daggers indicate significance based on cell type (‡p < 0.05, ‡‡p < 0.005). Asterisks denote differences based on polarization conditions: *p < 0.05, **p < 0.005).

