
FIGURE 4.
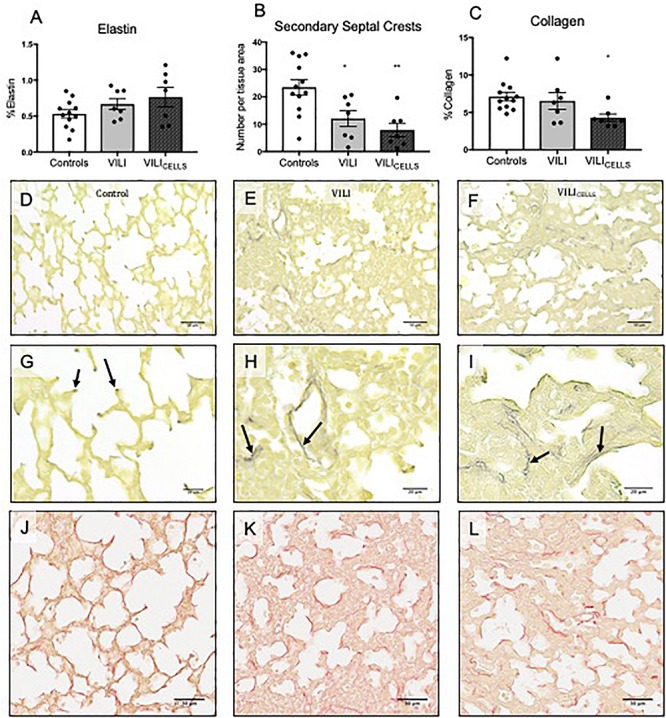
(A) %Elastin content in tissue. (B) Density of secondary septal crests expressed as number per tissue area. (C) %Collagen content in tissue. *P < 0.05, **P < 0.01 compared to controls. (D–L) Representative lung sections stained with HARTs to view elastin (black staining) in (D,G) control (E,H) VILI, and (F,I) VILICELLS. Arrows indicate elastin deposition at the points of septa in control lambs, which is irregular in the VILI and VILICELLS lambs. (J–L) Representative lung sections stained with picrosirius red to view collagen (dark red staining).