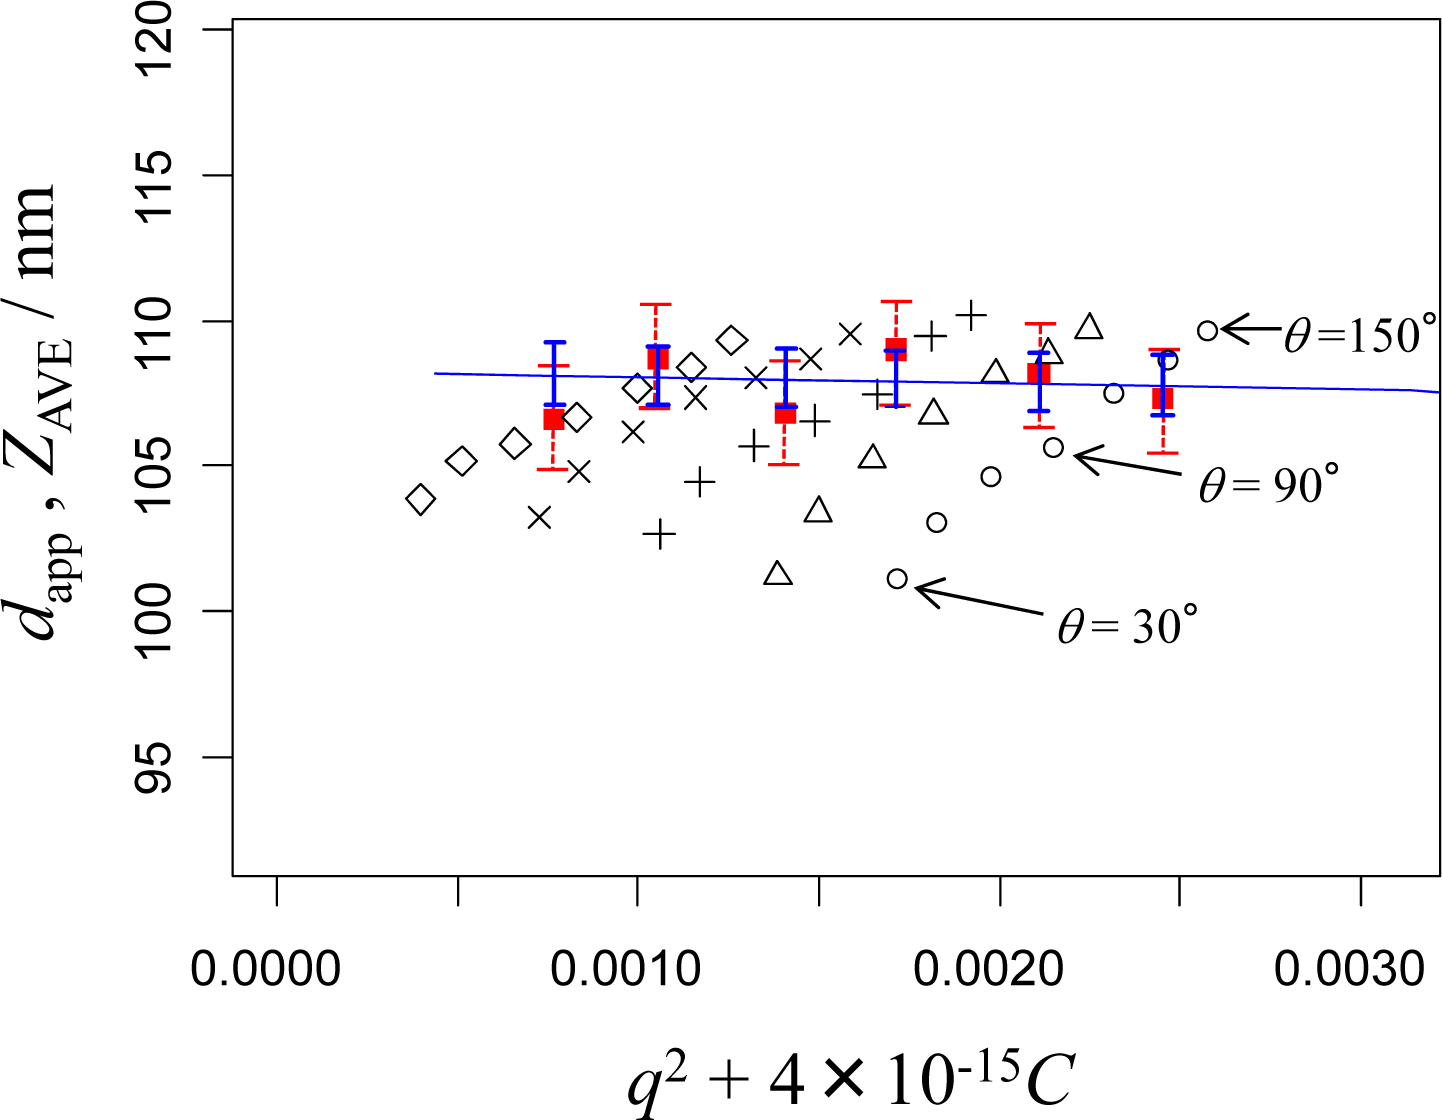
Figure 1.

DLS measurements of the apparent diameter of 100 nm PSL particles obtained in pure water at NMIJ, dapp (○, Δ, +, ×, and ◊) and NIST, ZAVE (filled squares). The straight line (with error bars indicating the ± confidence interval) is the calculated diameter based on the fit to the NMIJ data by Equation (10) for qNIST. The dotted error bars of the NIST data show the ± expanded uncertainty based on the repeatability and reproducibility of the experiments. The concentrations (× 1010 particles mL−1) at NMIJ are 41 (○), 33 (Δ), 25 (+), 16 (×), and 8.3 (◊). The concentrations (× 1010 particles mL−1) at NIST are 44, 35, 25, 18, 9, and 2.
