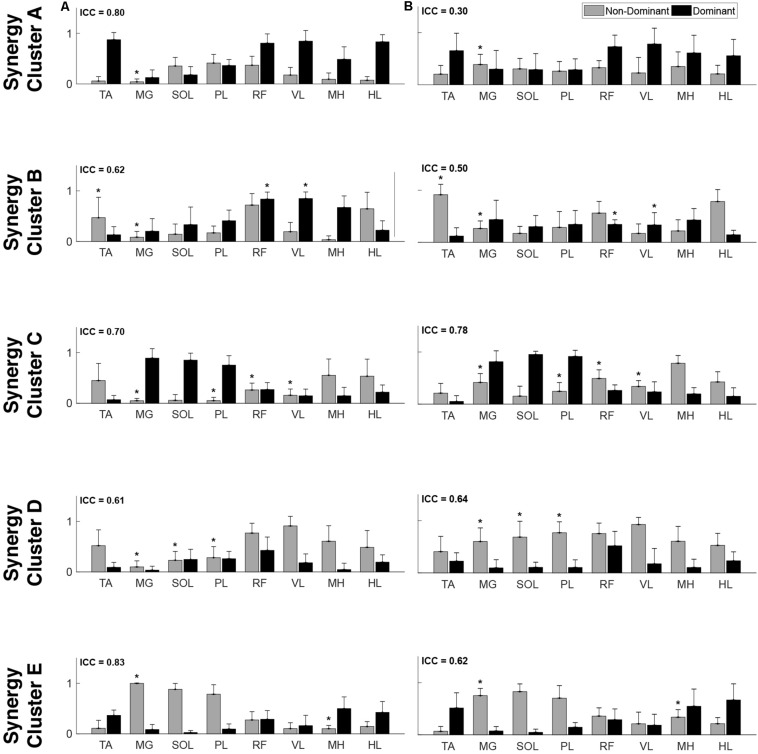
FIGURE 4.
Muscle synergy weightings. Mean (standard deviation) weight coefficients for each synergy cluster in (A) TD and (B) CP. Asterisks (*) indicate significant differences between groups for individual muscle weightings, relative to each synergy cluster (p < 0.01, independent t-test). Mean intraclass correlation coefficients (ICC) are reported in the upper left corner of each plot.

