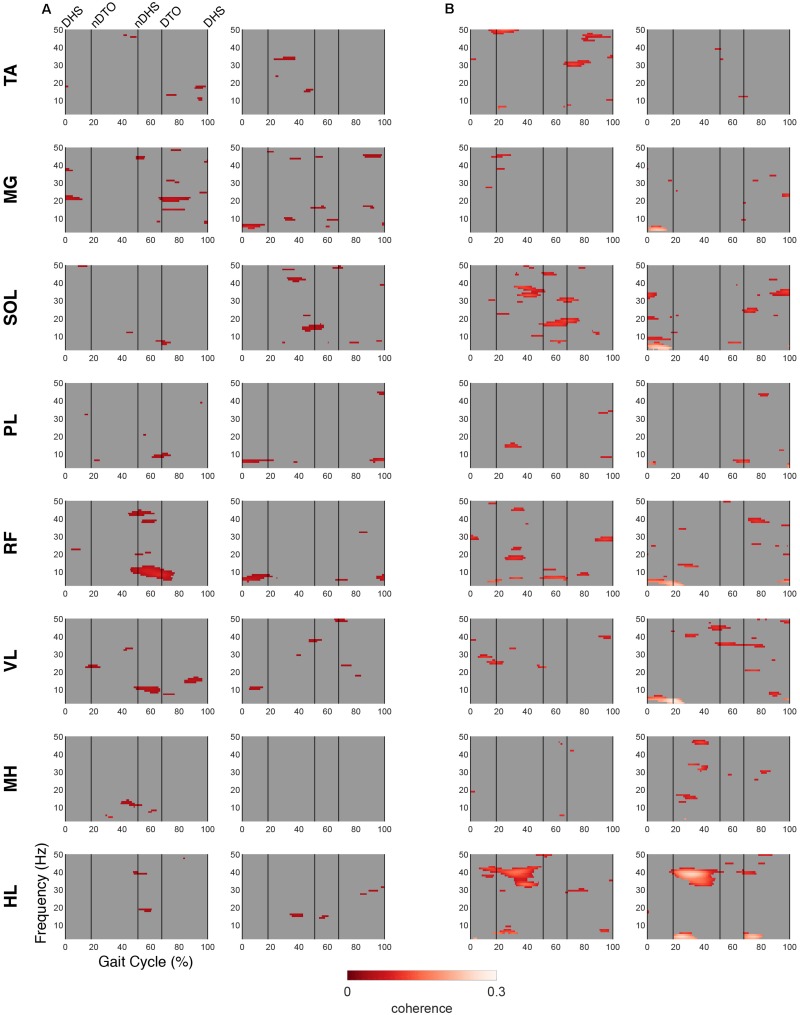
FIGURE 7.
EMG-IC coherence relative to non-dominant motor clusters. Linear coherence magnitudes between non-dominant (left)/dominant (right) EMG signals and non-dominant motor IC activations in (A) TD and (B) CP. Coherence plots were masked for significance (alpha <0.05); non-significant values and time points where EMG signals led IC activations (phase >0 radians) were set to 0 (gray).

