TABLE 3.
IC Cluster characteristics.
| IC Clusterlocation | Brodmannareasa | Scalp topographiesb | # of Subjects (ICs) | % of total subjects | |||
| TD | CP | TD | CP | TD | CP | ||
| Frontal | 6, 8, 32 | 5 (6) | 3 (5) | 45% | 38% | ||
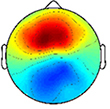 |
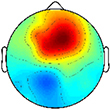 |
||||||
| Dominant parietal | 5, 7, 18, 19, 31, 39, 40 | 9 (10) | 5 (7) | 82% | 56% | ||
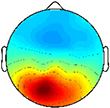 |
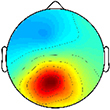 |
||||||
| Dominant motor | 3, 4, 6, 8, 9, 22 | 6 (9) | 6 (7) | 55% | 75% | ||
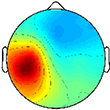 |
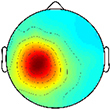 |
||||||
| Non-dominant motor | 3, 4, 6, 8, 22, 24 | 10 (12) | 3 (3) | 91% | 38% | ||
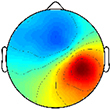 |
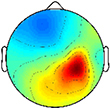 |
||||||
| Non-dominant parietal | 5, 7, 13, 18, 19, 22, 31, 39, 40 | 7 (13) | 6 (12) | 64% | 75% | ||
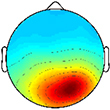 |
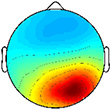 |
||||||
| Prefrontal | 6, 8, 9, 10, 24, 32 | 4 (6) | 6 (8) | 36% | 75% | ||
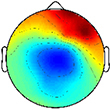 |
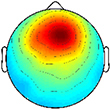 |
||||||
aBrodmann Areas were found within a ±2 mm area of all individual dipoles in each cluster bIndividual scalp topographies were inverted to best match the cluster polarity; individual topographies of the motor and parietal clusters were mirrored about the y-axis according to hemisphere dominance.
