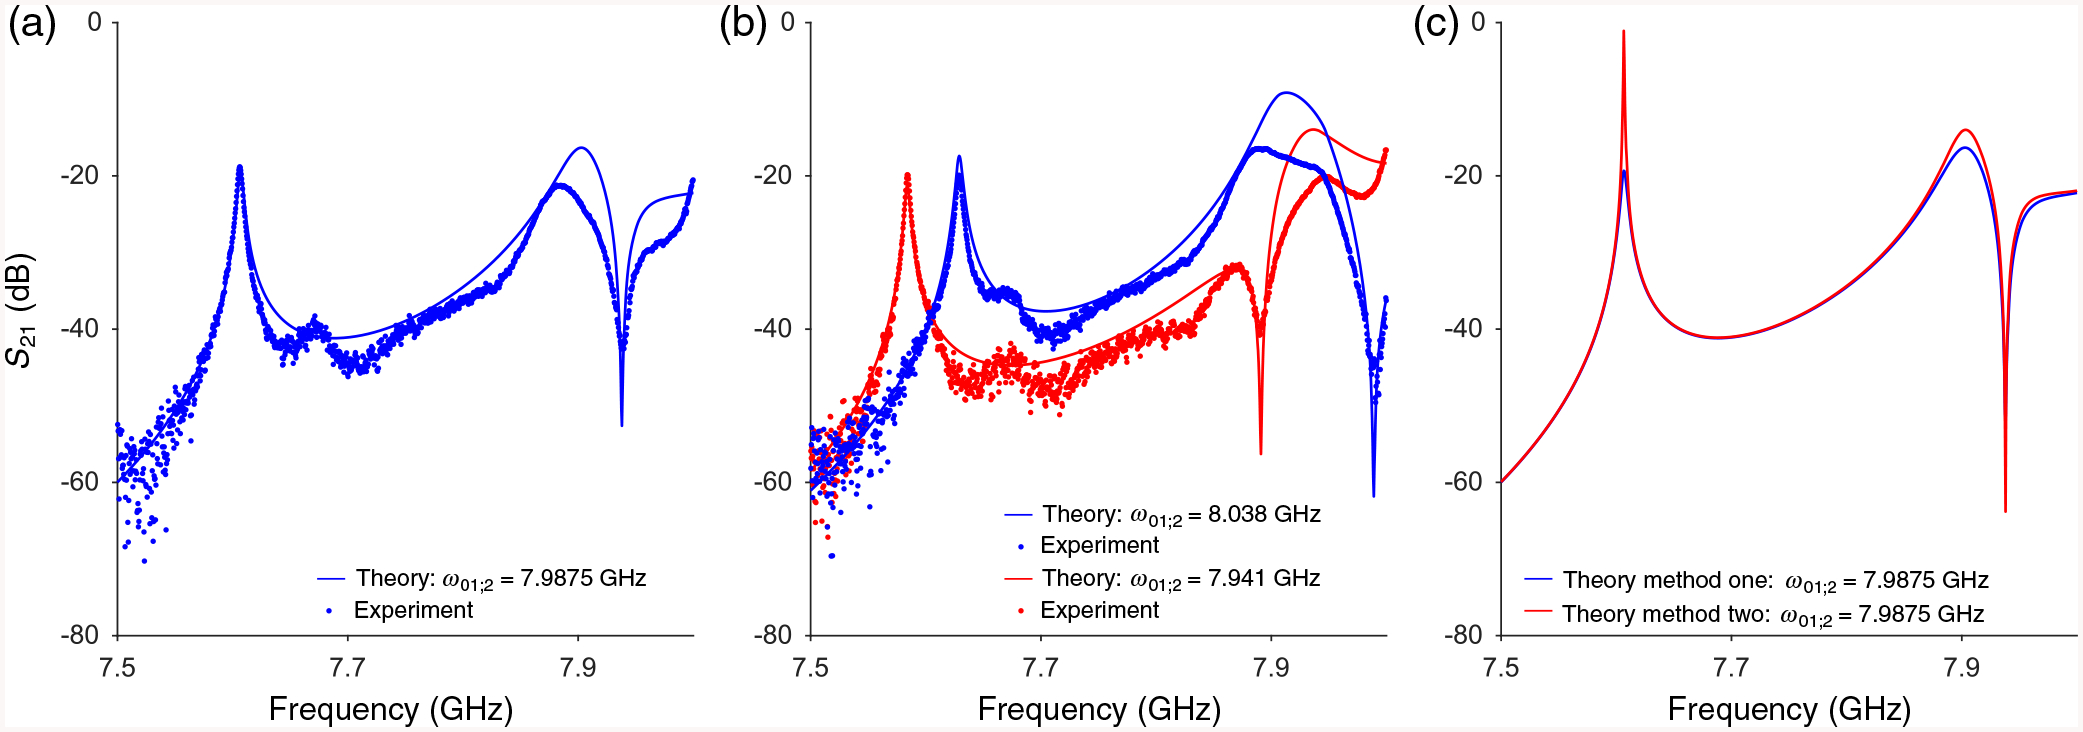
FIG. 6.

Dependence of transmission S21 on drive frequency, dependence used for determining the coupling strength of the second qubit, i.e., the one at site N/2 + 1 = 9. (a) Solid blue line is theoretical data for ω01;2 = 7.9875 GHz while blue dots are experimental data. We choose parameters of the Hamiltonian such that the bound-state frequency, the transmission dip frequency, and the linewidth of the bound state match the experimental data. (b) Solid blue line is theoretical data for ω01;2 = 7.941 GHz and blue dots are experimental data. Solid red line is theoretical data for ω01;2 = 8.038 GHz and red dots are experimental data. (c) Comparison of transmission methods for ω01;2 = 7.9875 GHz. The solid blue line is from method one, while the solid red line is from method two. The bound-state and transmission dip occur at the same frequencies for both methods.
