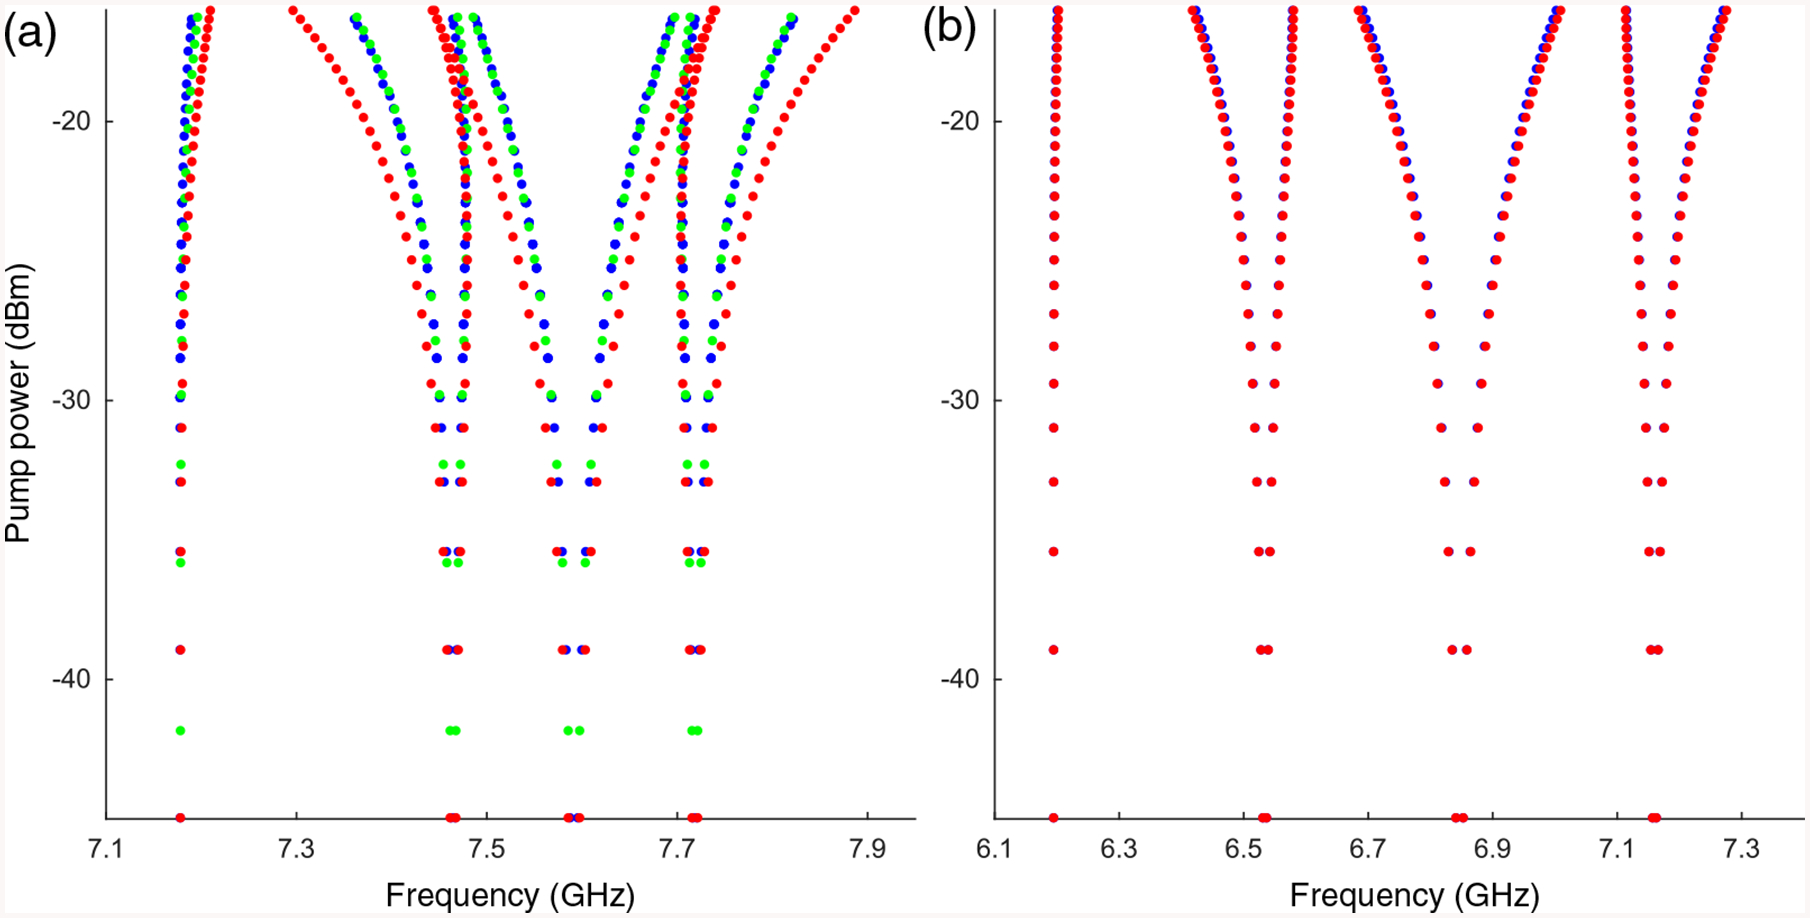
FIG. 9.

Theoretical simulations of the emission spectrum for different pump powers. Here, the blue squares are numerical results obtained from the total Hamiltonian Eq. (E1), the green squares are from the dressed-transmon Hamiltonian Eq. (E2), and the red squares are from Eq. (E2) but with cos θ = 1. (a) Here, ω01 = 7.97 GHz, and the bound-state frequency is 7.591 GHz. Using the appropriately reduced matrix element (cos θ < 1, blue squares) is crucial in obtaining accurate results using Eq. (E2). (b) Here, the bare qubit frequency of 7 GHz and the bound-state frequency of 6.847 GHz are both far from the band edge, so that cos θ ≈ 1 and the reduction in the matrix element can be neglected, so all three data sets lie on top of each other.
