Figure 4.

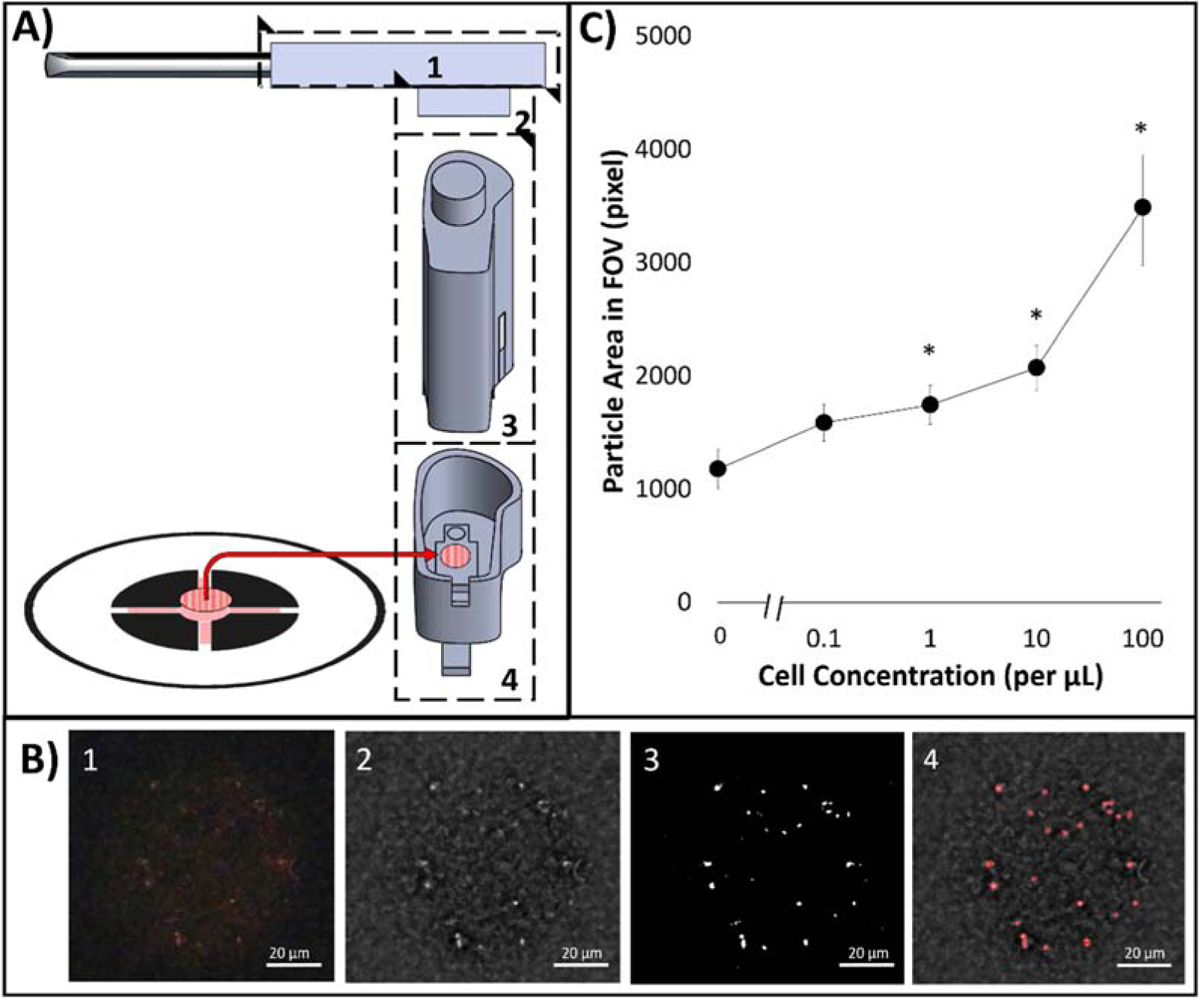
(A) On-chip particle counting analysis from the first capture layer of the dual-layer paper microfluidic chip using a smartphone-based fluorescence microscope. The smartphone-based fluorescence microscope is comprised of (1) a smartphone case (180 mm × 80 mm), (2) a 25-mm diameter, 589 ± 2 nm optical bandpass filter, (3) a commercial smartphone microscope attachment, replaced with a 525 nm LED, and (4) a 3D printed enclosure and a moveable stage with manual user lever. (B) Raw and processed smartphone images: (1) raw cropped 300X image, (2) Fourier bandpass noise filtered image, (3) image after grayscale normalization and global threshold binarization with threshold of 0.4, and (4) final image with augmented particle detection. (C) Particle areas in FOV in relation to dosed ROR1+ cell concentration from 0.1 to 100 cells/μL.
