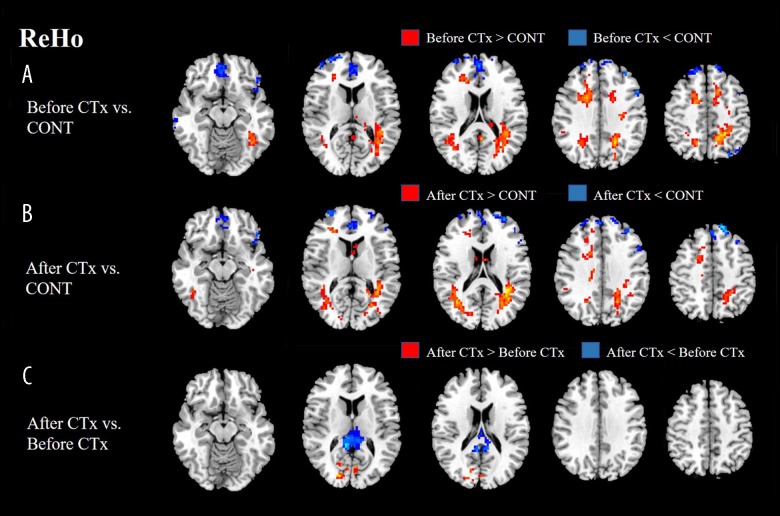
Figure 2.
(A) ReHo values of patients before CTx displayed a significant decrease in bilateral frontal and left parietal regions. (B) Patients after CTx showed a significantly decreased ReHo in the bilateral frontal regions. (C) ReHo values of patients after CTx displayed a significant decrease in right PCC, while displaying significant increase in right middle occipital gyrus compared with ReHo values of patients before CTx. ReHo – regional homogeneity; CTx – chemotherapy; CONT – controls.

