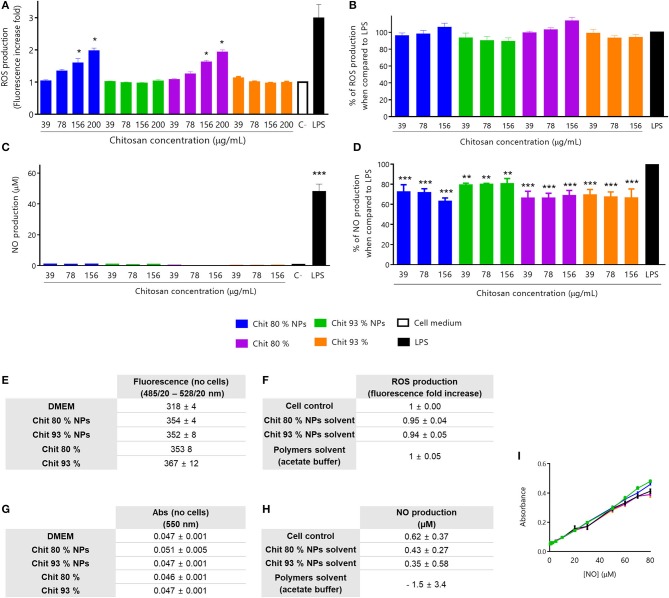
Figure 4.
Immunotoxicity assays in RAW 264.7 cell line. All assays were performed with non-cytotoxic concentrations of NPs, polymers and controls (evaluated by MTT assay after every experiment). (A) ROS production stimulated by Chit 80% NPs, Chit 93% NPs and the respective polymers prepared in endotoxin-free and sterile conditions. For the experiment, test samples were incubated with RAW 264.7 cell line for 24 h, as well as LPS, as a positive control. Mean ± SEM; obtained from four independent experiments, each performed in triplicate (n = 4), *p < 0.05 compared to control. (B) Inhibition of ROS production by Chit 80% NPs, Chit 93% NPs and the respective Chit polymers prepared in endotoxin-free and sterile conditions. For the experiment, LPS and test samples were co-incubated with RAW 264.7 cell line for 24 h. Mean ± SEM, obtained from a minimum of seven independent experiments, each performed in triplicate (n ≥ 7). (C) NO production stimulated by Chit 80% NPs, Chit 93% NPs and the respective polymers prepared in endotoxin-free and sterile conditions. For the experiment, test samples were incubated with RAW 264.7 cell line for 24 h, as well as LPS, as a positive control. Mean ± SEM, obtained from a minimum of three independent experiments, each performed in triplicate (n ≥ 3), ***p < 0.001 compared to control. (D) Inhibition of NO production by Chit 80% NPs, Chit 93% NPs and the respective polymers prepared in endotoxin-free and sterile conditions. For the experiment, LPS and test samples were co-incubated with RAW 264.7 cell line for 24 h. Negative control (C–) was not co-incubated with LPS. Mean ± SEM, obtained from a minimum of three independent experiments, each performed in triplicate (n ≥ 3), **p < 0.01 and ***p < 0.001 compared to LPS control. (E) Evaluation of possible NP and polymer interference with the wavelength used to read ROS assay (Ex485/20 – Em528/20) (Mean ± SEM, n = 3). (F) Evaluation of the ROS production (fluorescence fold increase) induced by the NPs solvent and polymers solvent (n = 3). Data are presented as mean ± SEM. (G) Evaluation of possible NP and polymer interference with the wavelength used to read NO assay (550 nm) (Mean ± SEM, n = 3). (H) Evaluation of the NO production (%) induced by the NPs solvent and polymers solvent (% of control) (n = 3). Data are presented as mean ± SEM. (I) Control of interferences of (A) Chit NPs and (B) Chit polymers with known concentrations of NO without cells (Mean ± SEM, n = 3).

