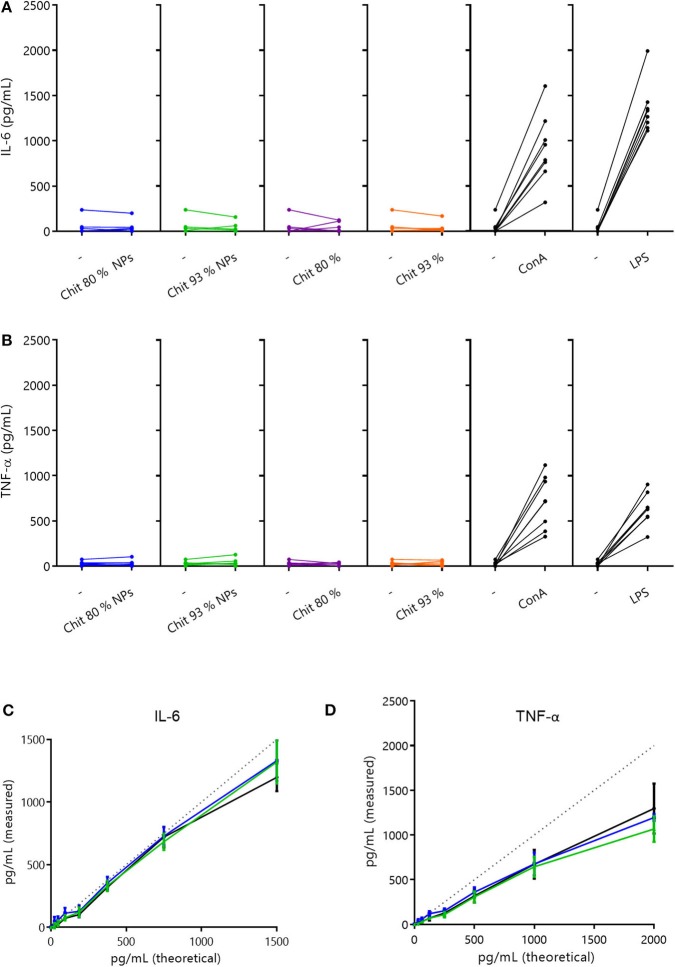
Figure 6.
Cytokine secretion in PBMCs and interference evaluation. (A,B) Cytokine secretion induced by 100 μg/mL of Chit 80% and Chit 93% polymers and NPs on human PBMCs, after 24 h incubation (A- IL-6 and B- TNF-α). Cytokine quantification was performed by ELISA. Results illustrate the increase in cytokine production (Chit 80% NPs, Chit 93% NPs, Chit 80%, Chit 93%, ConA, LPS), when compared to the basal level (–). The experiment was repeated with blood from eight different donors (n = 8). (C,D) Evaluation of the Chit 80% and Chit 93% NPs ability to interfere with cytokine quantification when compared to the cell culture media (experiment without cells). The results of the cytokine quantification for the calibration curve in the presence of Chit 80% NPs and Chit 93% NPs were compared to the cytokine quantification of the calibration curve in simple cell culture media (C- IL-6 and D- TNF-α). Dotted lines represent the original calibration curve in ELISA diluent. Data are represented as mean ± SEM (n = 3).

