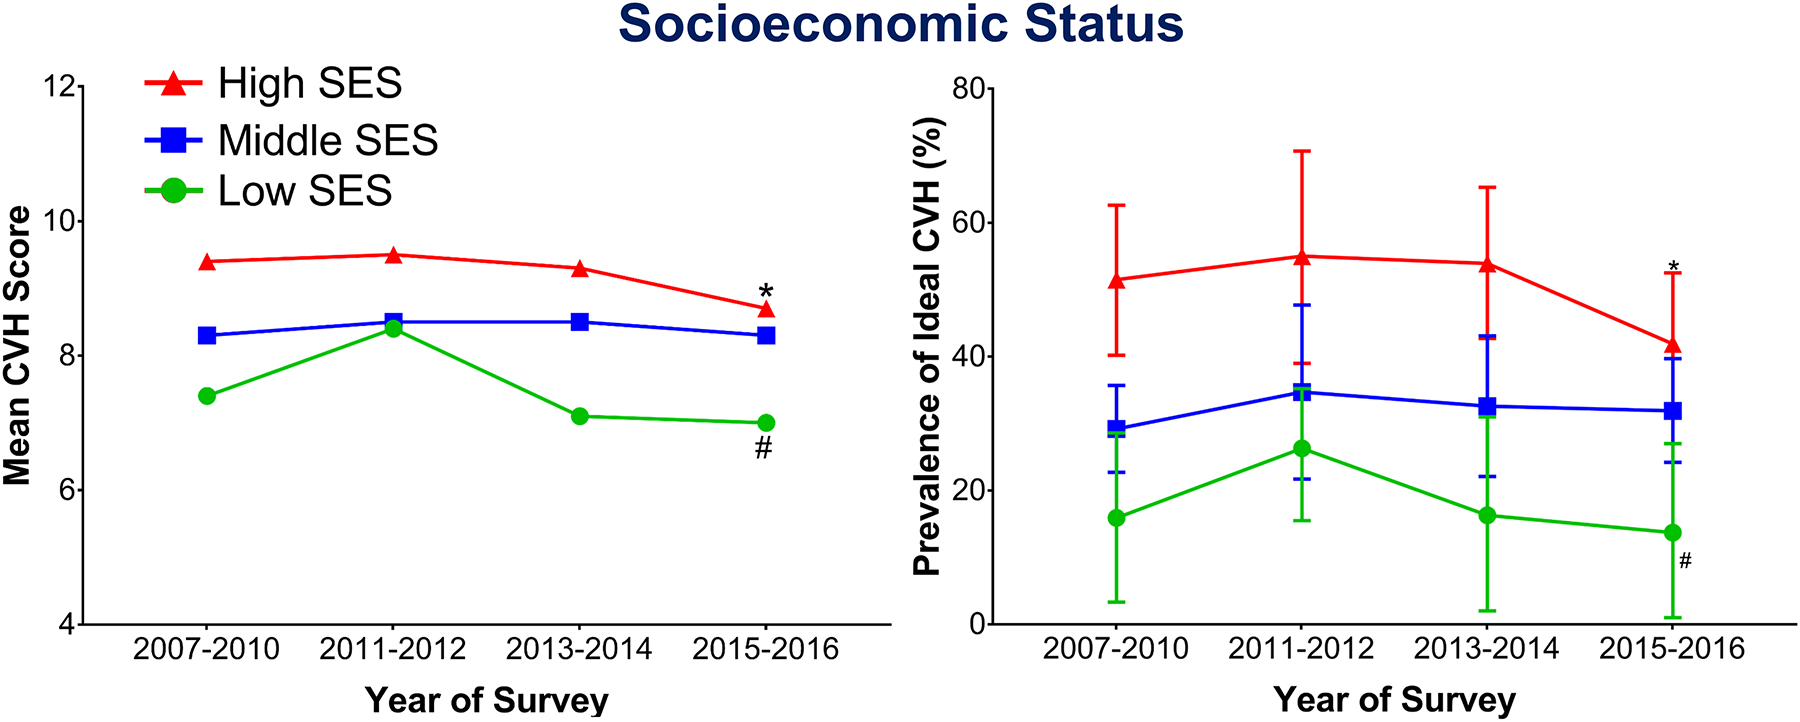
Figure 1.

The trends in mean (A) and ideal (B) cardiovascular health according to socioeconomic status by National Health and Nutrition Examination Survey cycle. (A) The symbols indicate covariate adjusted mean cardiovascular health. The red triangle with redline represents trends of mean cardiovascular health in participants from high socioeconomic strata (Plinear =0.007). The blue square with the blue line represents trends of mean cardiovascular health in participants from middle socioeconomic strata (Plinear and Pquadratic >0.05). The green circle with the green line represents trends of mean cardiovascular health in participants from low socioeconomic strata (Pquadratic =0.007). Values were estimated from multivariable linear regression analysis including age, sex, race, insurance status, and number of health care visits. Trend P values were estimated from multivariable logistic regression analysis including age, sex, race, insurance status, number of health care visits, and Bonferroni correction for multiple testing. * denotes trend P value of 0.007; # denotes trend P value of 0.007. (B) The symbols indicate covariate adjusted percentage prevalence with 95% confidence interval (error bars). The red triangle with redline represents trends of ideal cardiovascular health in participants from high socioeconomic strata (Pquadratic =0.01). The blue square with the blue line represents trends of ideal cardiovascular health in participants from middle socioeconomic strata (Plinear and Pquadratic>0.05). The green circle with the green line represents trends of ideal cardiovascular health in participants from low-socioeconomic strata (Pquadratic =0.02). Values were estimated from multivariable linear regression analysis including age, sex, race, insurance status, and number of health care visits. Trend P values were estimated from multivariable logistic regression analysis including age, sex, race, insurance status, number of health care visits, and Bonferroni correction for multiple testing. * denotes trend P value of 0.01; # denotes trend P value of 0.02.
