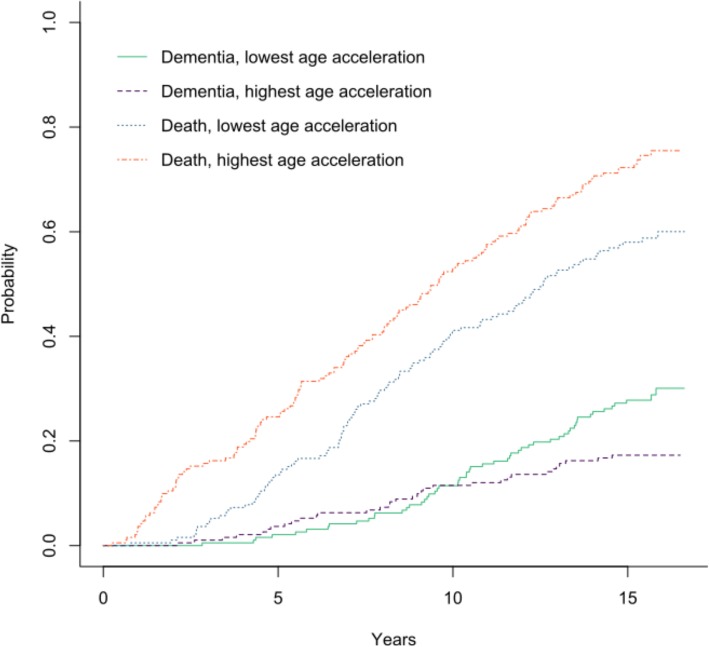
Fig. 3.
Cumulative incidence plots for AgeAccelGrim: death and dementia. Note. The two groups for each event (death and dementia) were formed from the half of participants with higher age acceleration levels who experienced that event and the half with lower age acceleration levels that experienced that same event. A steeper rising line indicates that individuals in this group were at greatest risk for the event, e.g., in general, individuals were more at risk for death than dementia

