
Fig. 4.
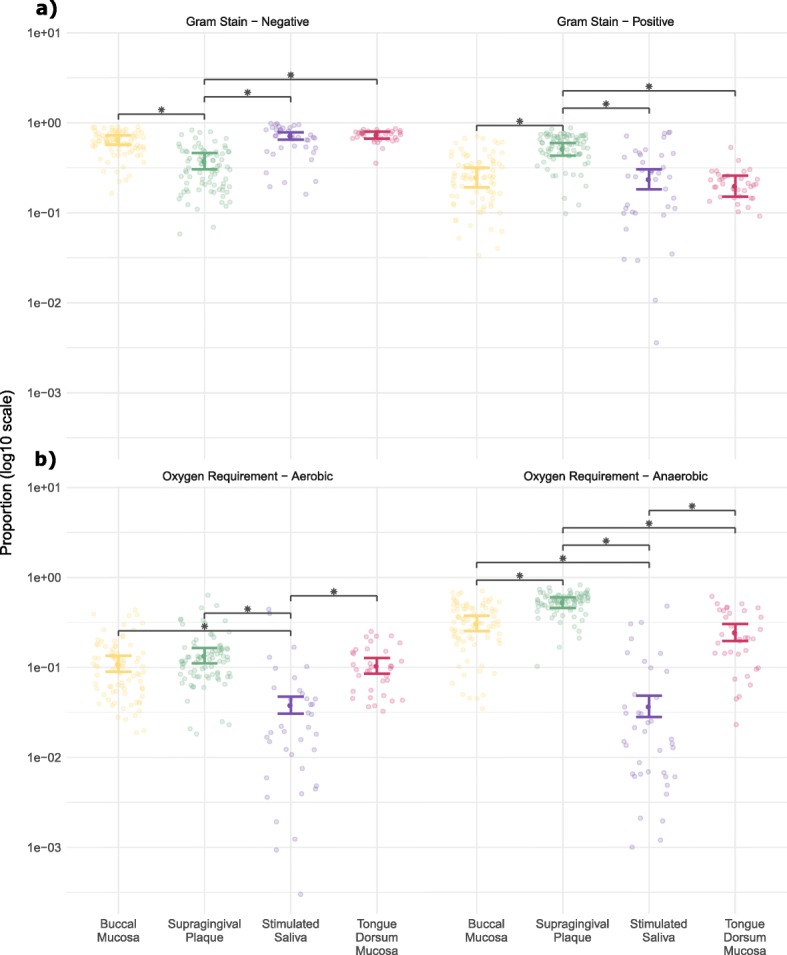
Proportions of bacterial species per sample discriminated by (a) Gram-stain status and (b) oxygen requirements. Coloured bars indicate mean proportions of OTUs with 95% confidence intervals across the canine oral niches: Buccal mucosa (yellow), supragingival plaque (green), saliva (purple) and tongue dorsum mucosa (magenta). Black bars and asterisks indicate niches with significant differences (all p < 0.001)