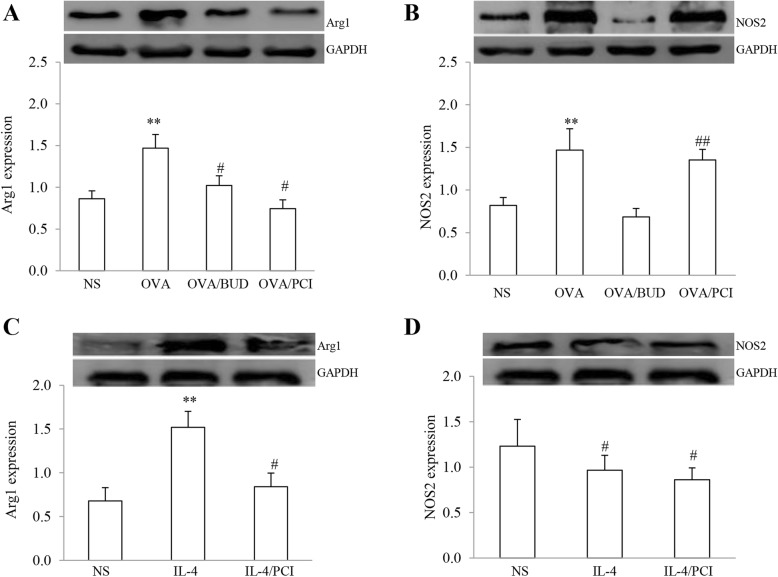
Fig. 4.
Arg1 and NOS2 protein expression in lungs and macrophages. Arg1 and NOS2 proteins in lung tissues (a, b) and macrophages (c, d) were present on images and quantitation of both proteins was executed by calculating the value from the relative band intensity of each target protein/GAPDH protein. The results were expressed as Mean ± SD (n = 3). **: P < 0.01 vs NS, OVA/BUD and OVA/PCI except NOS2 in PCI-treated lungs or vs NS and IL-4/PCI in the cells. #, ##: P < 0.05 or 0.01 vs NS

