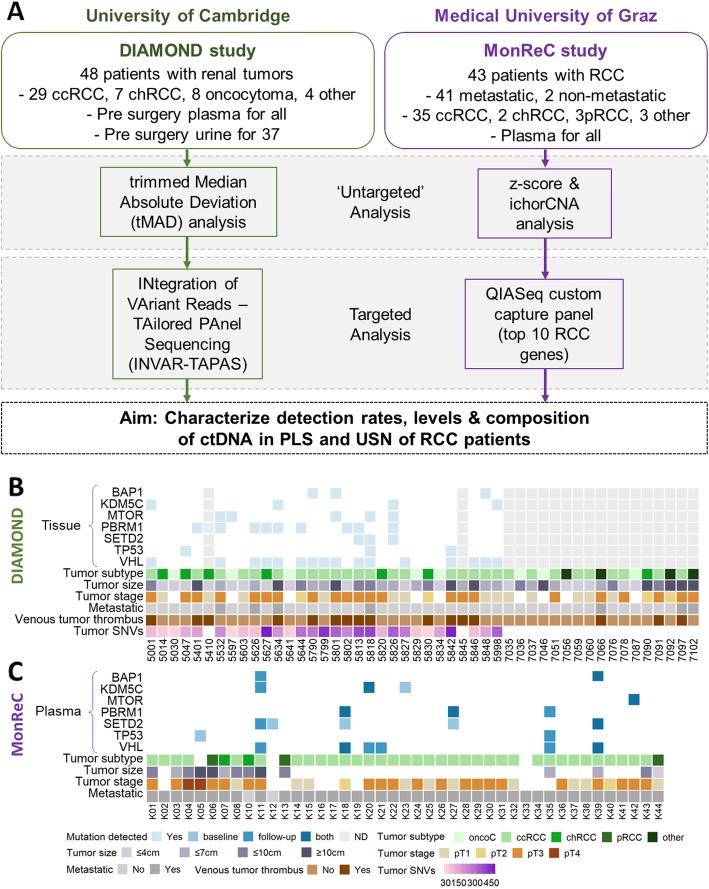
Fig. 1.
Study design, patient characteristics, and tumor genomic profile. a ctDNA analysis in RCC patients was applied to two patient cohorts, DIAMOND and MonReC. Initially, untargeted sequencing methods were applied to samples. For DIAMOND, tMAD analysis of sWGS data was applied. For MonReC, a combination of z-score analyses of mFAST-SeqS data and ichorCNA analysis of sWGS data was applied. Subsequently, targeted sequencing methods were used. For DIAMOND, INVAR-TAPAS was applied to patient plasma (n = 29) and urine (n = 20). For MonReC, a QIASeq custom capture panel targeting the 10 most commonly mutated genes in RCC patients was applied. b For DIAMOND, plasma (n = 48) and urine (n = 37) were collected from patients with a range of tumor subtypes and stages. Specifically, 29 ccRCCs (11/1/16 stage I, II, and III respectively), 7 chRCCs (2/2/3 stage I, II, and III), 8 oncocytomas, 1 patient with papillary RCC (stage III), 1 patient with a MiT family translocation RCC (stage II), and 2 patients with oncocytic renal neoplasm. Shown, in descending order, are tumor tissue mutation status of frequently mutated RCC genes (pale blue cubes indicate that a mutation was detected, white space indicates that no mutation was detected, gray columns indicate that tissue was not available for that patient), tumor subtype, tumor size, tumor stage, metastatic at baseline, evidence of venous tumor thrombus, and number of tumor SNVs (targeted for INVAR-TAPAS). c For MonReC, plasma (n = 43) was collected from 41 patients with metastatic RCC and two with localized RCC. Shown, in descending order, are plasma mutation status (after QIASeq, blue, medium blue and dark blue cubes indicate that a mutation was detected at baseline, during follow-up, or at both time points respectively) of frequently mutated RCC genes, tumor subtype, tumor size, and metastatic at time of sampling. More comprehensive versions of b and c are provided in Additional file 1: Fig. S15

