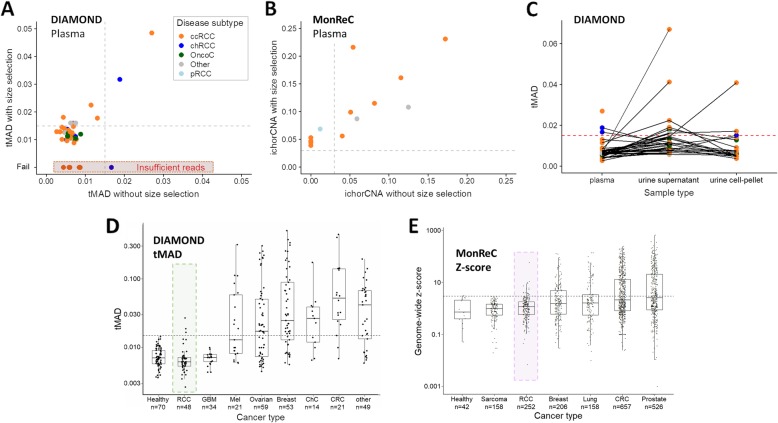
Fig. 2.
ctDNA detection using untargeted assays. a Distribution of tMAD scores across DIAMOND plasma samples (x-axis). Data points are colored according to disease subtype. A tMAD score of > 0.015 (gray dashed line) indicates SCNA, and thus ctDNA. ctDNA was detected in 3/48 (6.3%) plasma samples. Data on the y-axis show tMAD scores for the same plasma samples after in silico size selection for sequencing reads 90–150 bp in length. On average, the tMAD score increased 2.2-fold (range 1.25–4.83) and led to ctDNA detection in 8 additional patient samples, resulting in ctDNA detection in 11/48 (22.9%) DIAMOND patients. Four patient samples had insufficient sequencing reads after size selection for tMAD analysis (red highlight). b Tumor fraction of MonReC ctDNA-positive plasma samples (n = 14), as calculated by ichorCNA, before and after in silico size selection for sequencing reads 90–150 bp in length. On average, tumor fraction increased 2.2-fold (range 0.9–5.7) and revealed six patients with detected ctDNA, in addition to the eight patient samples detected without size selection. c Plot showing distribution of tMAD scores across DIAMOND plasma (no size selection), urine supernatant (USN), and urine cell pellet (UCP) samples. Samples from the same patient are connected by gray lines. The detection threshold is indicated by a red dashed line. d tMAD and e z-score distribution of RCC samples were compared to samples from other cancer types collected at the University of Cambridge [19] and Medical University of Graz respectively. Renal samples are highlighted. GBM = glioblastoma, Mel = melanoma, ChC = cholangiocarcinoma, CRC = colorectal cancer. A similar comparison was carried out using the ichorCNA metric (Additional file 1: Fig. S7C)

