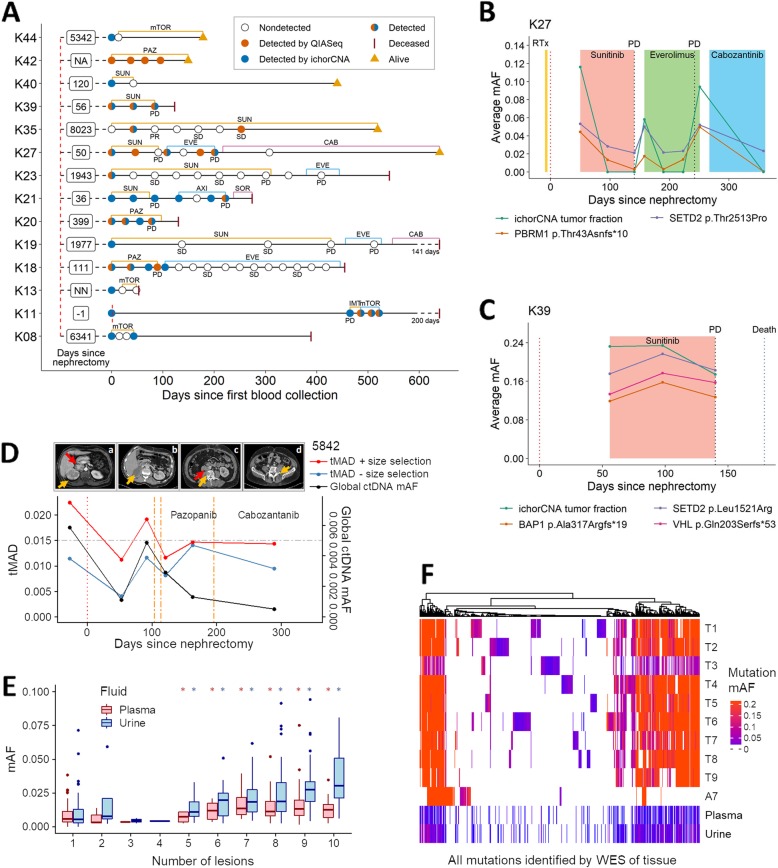
Fig. 5.
Longitudinal ctDNA analysis and assessment of intratumoral heterogeneity in plasma and urine. a Longitudinal cfDNA assessment of MonReC patients with metastatic RCC. Shown are disease courses of patients who had detected ctDNA with QIASeq and/or ichorCNA analysis. Time between nephrectomy and first blood draw is indicated in days (NA, not available; NN, no nephrectomy). Type and duration of treatment (mTOR = mTOR inhibitor; PAZ = pazopanib, SUN = sunitinib; EVE = everolimus; CAB = cabozantinib; AXI = axitinib; SOR = sorafenib; IMT = immune therapy) are indicated by colored lines. Most patients had detected ctDNA at progression (PD), whereas during stable disease (SD) or response (partial response, PR) ctDNA was undetected. b, c Plots demonstrating dynamic changes in ctDNA in longitudinal plasma from MonReC patients K27 and K39 respectively. Further details and patient specific plots are in Additional file 1: Fig. S17. d tMAD (left y-axis) and INVAR-TAPAS (right) analysis of plasma taken throughout the clinical course of DIAMOND patient 5842. Following nephrectomy (scan a; orange arrow = right renal tumor, red arrow = tumor thrombus), while INVAR-TAPAS global ctDNA levels (black line) drop, it remains detected (gmAF = 9.5 × 10⁻⁴) at day 53, indicating residual disease. Conversely, imaging did not detect residual disease at day 16 (b; normal renal fossa). ctDNA levels rise with disease spread, before falling again upon the commencement of radio- and chemotherapy. Of note, ctDNA levels continue to fall despite evidence of clinical progression. Further details are provided in Additional file 1: Fig. S18A-B. tMAD values before (blue line) and after (red line, gray circles = detected ctDNA) size selection are shown. Urine data are shown in Additional file 1: Fig. S18C. e Comparison of baseline ctDNA mAF in plasma (red) and USN (blue) and the number of tumor regions that mutation was observed in after multi-region sampling of 5842. *indicates significant difference as compared to mutations detected in just one region. f Heatmap of mutations detected across 10 tumor biopsies (T1–T9 = fresh frozen, A7 = FFPE) and baseline fluid samples from 5842, with vertical colored lines indicating individual SNVs. Hierarchical clustering was by mutation according to Euclidean distance. Color intensity corresponds to mutation mAF. While mutations show different representation in pre-surgery fluids (Additional file 1: Fig. S23), all mutation clusters, even those private to individual regions, are represented by at least one mutation in plasma and urine (Additional file 1: Fig. S24)

