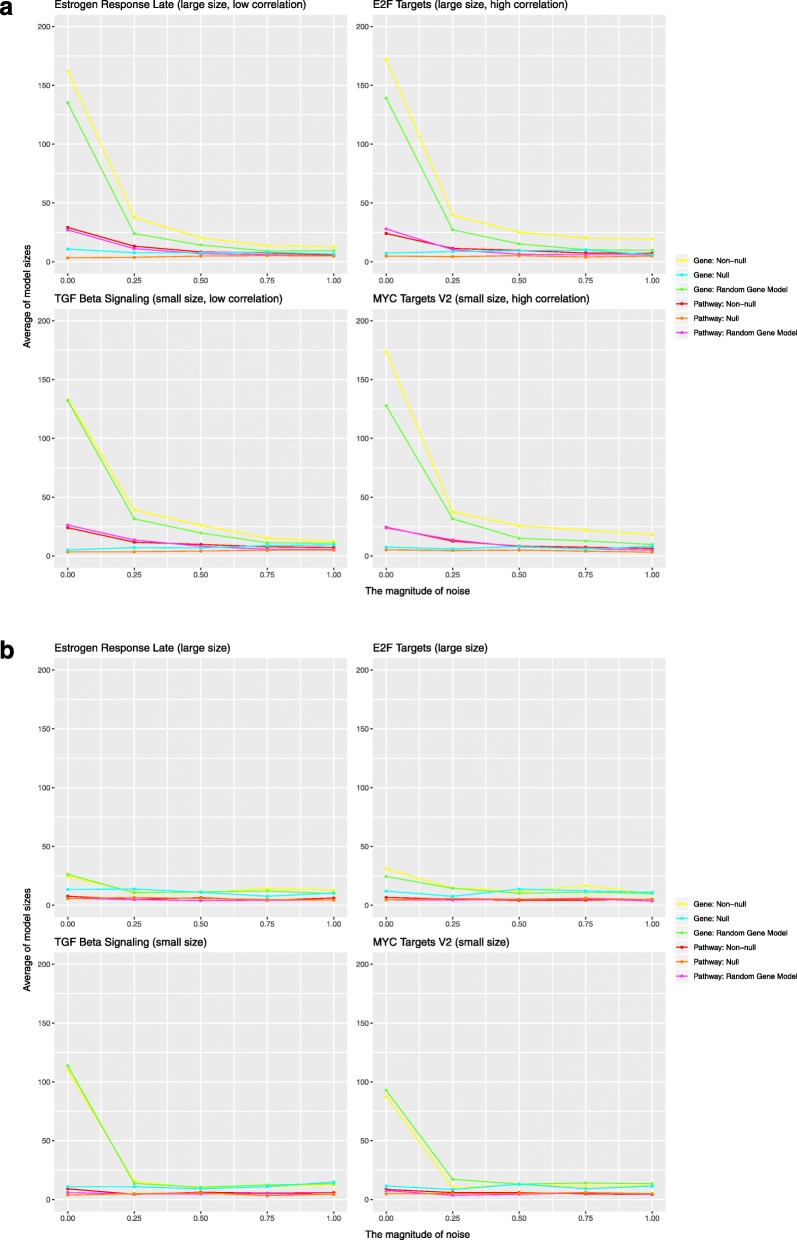
Fig. 7.
Average number of predictors in the non-null models. a Each plot shows the average number of predictors as a function of added noise for the simulation studies that did not alter the inter-gene correlation structure. b The average number predictors for the simulation studies where the inter-gene correlation structure was broken

