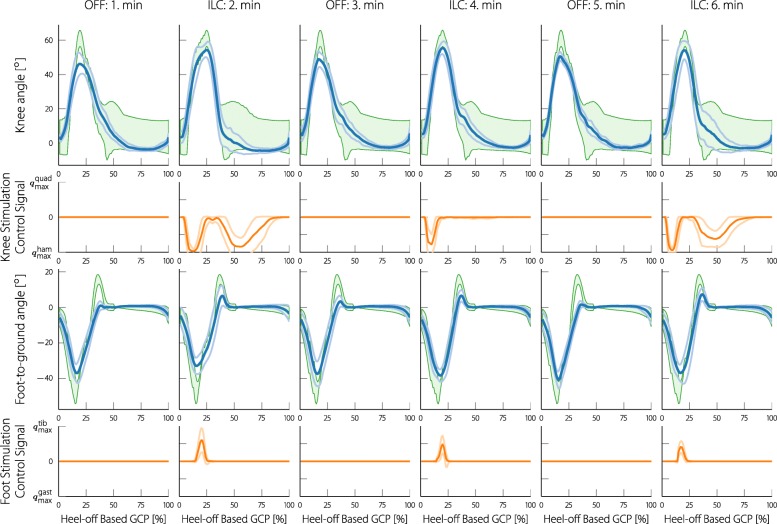
Fig. 14.
Mean and standard deviations of the knee and foot joint angles of participant 2 during the first six minutes of the experiment. For the first minute the neuroprosthesis was turned off, for the second minute it was turned on, and so forth. The joint angles were all resampled to the gait cycle percentage domain. The green areas in the background are the reference bands that were used during the experiment (for participant 2 a wider knee reference band was used). The reference bands are fitted to the mean joint angles using DTW similarly to how the reference is fitted to each individual step in the real-time gait assessment. In this representation, the gait cycle is started with the heel-off event for both the knee and the foot angle. Below the joint angles, the respective stimulation control signals (mean and standard deviation) are presented. For the knee a positive control signal implies quadriceps stimulation and a negative signal hamstring stimulation. For the foot control signal, positive values imply tibialis stimulation and negative values gastrocnemius stimulation. The positive and negative planes of the control signal were scaled to the maximum tolerated stimulation for the respective muscle of the participant (the values can be found in Table 2)

