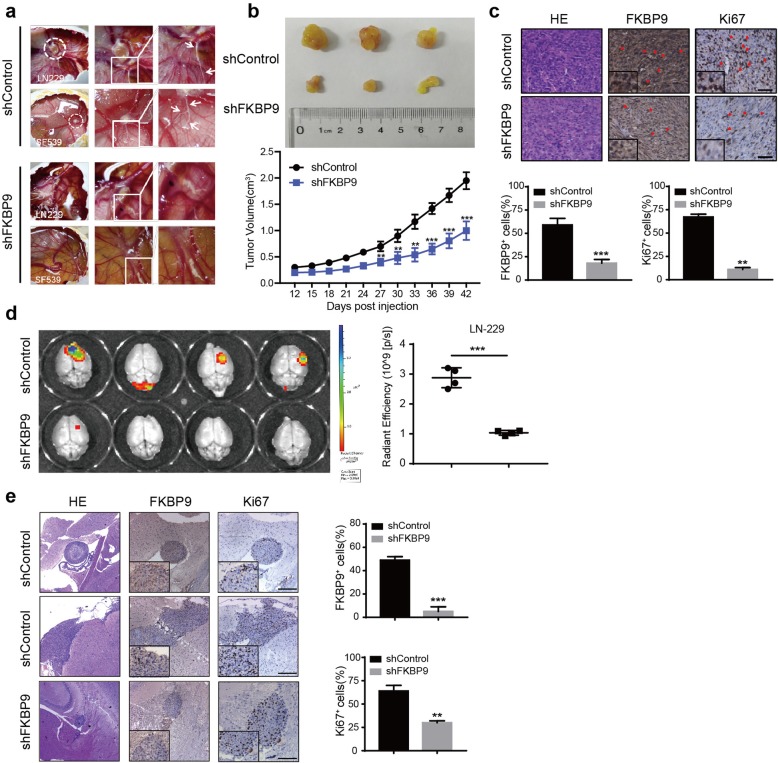
Fig. 3.
FKBP9 depletion suppresses GBM growth in vivo. a Images of chick embryo’s chorioallantoic membrane (CAM) tumors in shControl and shFKBP9 cells 7 days after implantation. LN229-shControl and LN229-shFKBP9 cells (n = 4 eggs for each group), SF-539-shControl and SF-539-shFKBP9 cells (n = 5 eggs for each group) were digested and implanted as an amount of 1.0 × 10⁶ per egg. Tumors were circled with white dotted lines, and the areas marked with squares were enlarged to show cell invasion along blood vessels which was indicated with arrows. b Representative images of tumors derived from SF-539-shControl (n = 5 mice) and SF-539-shFKBP9 cells (n = 5 mice) 45 days post injection. Tumor volumes were measured every three days. c HE staining was performed in SF-539-shControl and SF-539-shFKBP9 tumors, and the expression of FKBP9 and Ki67 were detected by IHC assays. Scale bar = 50 μm. Magnified insets showed FKBP9 or Ki67 positive stained cells. d Intracranial injection of LN-229 cells with or without FKBP9 depletion into nude mice (n = 8). Bioluminescent images and quantification of xenografts derived from LN-229 implantation were shown. e Representative images of HE and tumor sections staining with FKBP9 and Ki67 by IHC were shown. (**p < 0.01, ***p < 0.001)

