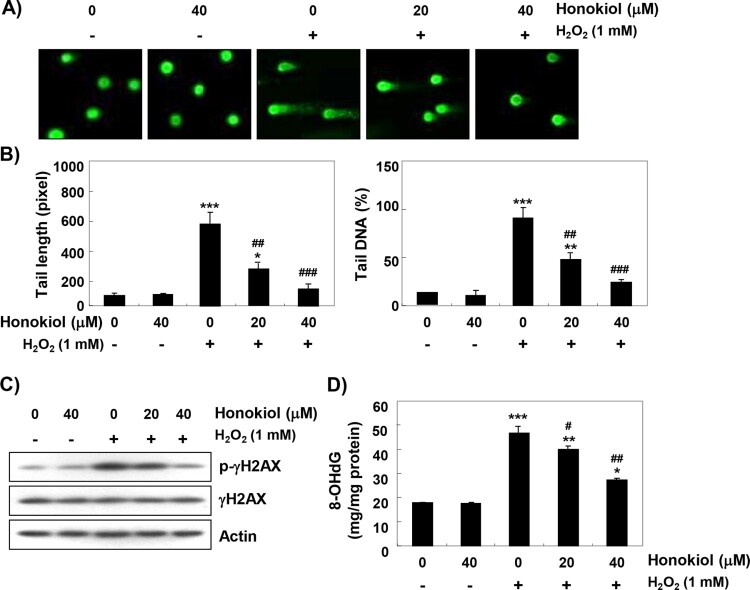
Figure 3.
Protection of H2O2-induced DNA damage by honokiol. Cells were pretreated with honokiol for 1 h, and then stimulated with or without 1 mM H2O2 for 24 h. (A) The comet assay was performed, and representative images of comet assay were taken. (B) The statistical analysis of tail length and tail DNA percentage. Statistical analyses were conducted using analysis of variance (ANOVA-Tukey’s post hoc test) between groups. *p < 0.05, **p < 0.01 and ***p < 0.001 vs control group, ##p < 0.01 and ###p < 0.001 vs H2O2-treated group. (C) The cellular proteins were prepared, and p-γH2AX and γH2AX protein levels were assayed by Western blot analysis. (D) The amount of 8-OHdG in DNA was determined using an 8-OHdG-EIA kit. The measurements were made in triplicate, and values are expressed as the mean ± SD. Statistical analyses were conducted using analysis of variance (ANOVA-Tukey’s post hoc test) between groups. *p < 0.05, **p < 0.01 and ***p < 0.001 vs control group, #p < 0.05 and ##p < 0.01 vs H2O2-treated group.

