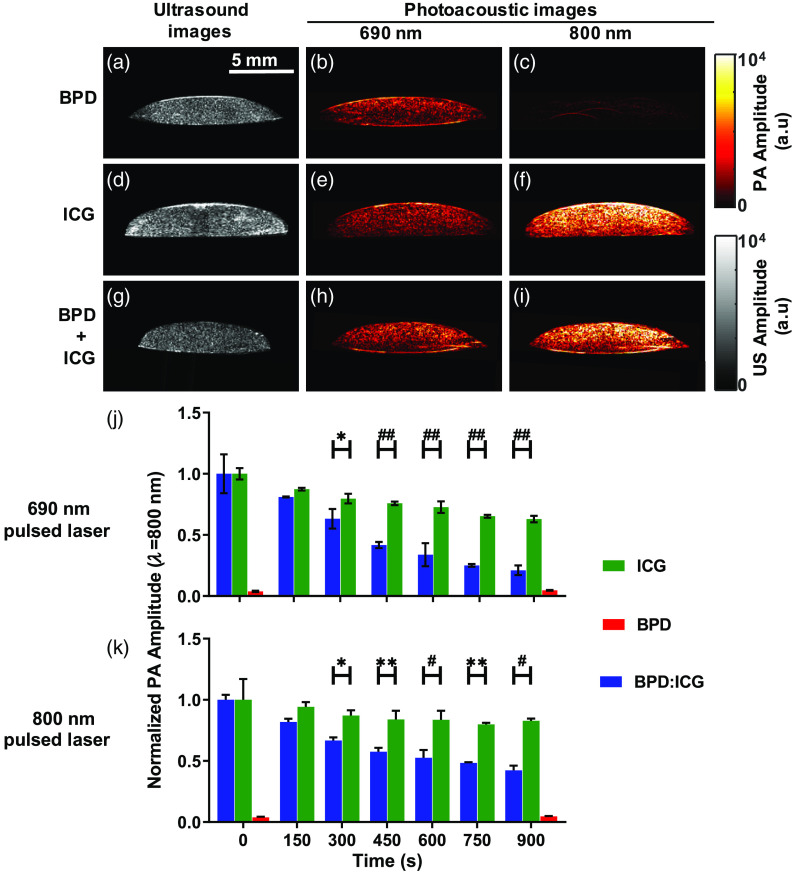
Fig. 6.
(a), (d), and (g) US and PA images at (b), (e), and (h) 690 nm and (c), (f), and (i) 800 nm of a tissue-mimicking phantom made of FaDu cells incubated with (a)–(c) BPD (for 1 h), (d)–(f) ICG (for 24 h), and (g)–(i) BPD and ICG combination for 1 and 24 h, respectively. (j) and (k) Normalized PA signal as a function of pulsed irradiation time (or PDT power), monitored at 800 nm; (j) irradiation at 690 nm for ICG (green), BPD (red), and (blue); (k) similar to (j) except with 800 nm irradiation. Error bars show the standard deviations from three separate measurements taken at each interval. BPD-only signal (red) was close to the noise level because of negligible absorption at 800 nm. Two-way ANOVA Sidak’s multiple comparison test was performed to identify statistically significant difference between the groups and p-value, where was considered significant; * , ** , # , and ## .

