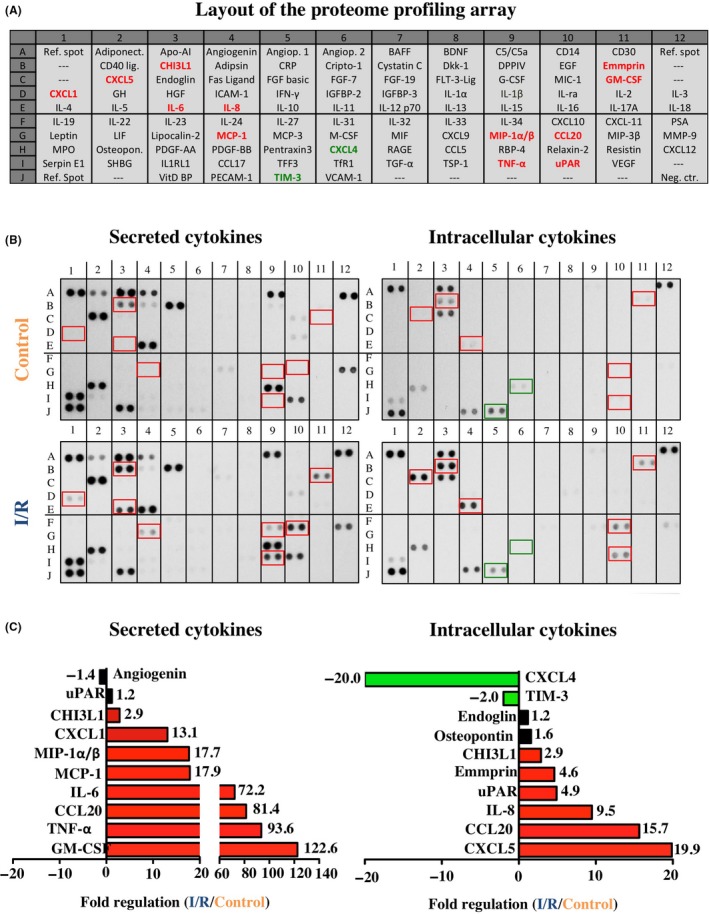
Figure 3.

Profiling of secreted and intracellular cytokines. A, Analysed cytokines and location on the respective array membrane. B, Red font and rectangles represent intracellular and secreted cytokines that were more than two‐fold upregulated by I/R, while green font and rectangles indicate a more than two‐fold downregulation. C, Top ten most regulated proteins. All proteins are presented as duplicate spots on the respective array membrane. For a detailed description of the array proteins please refer to Appendix S2
