
Figure 4.
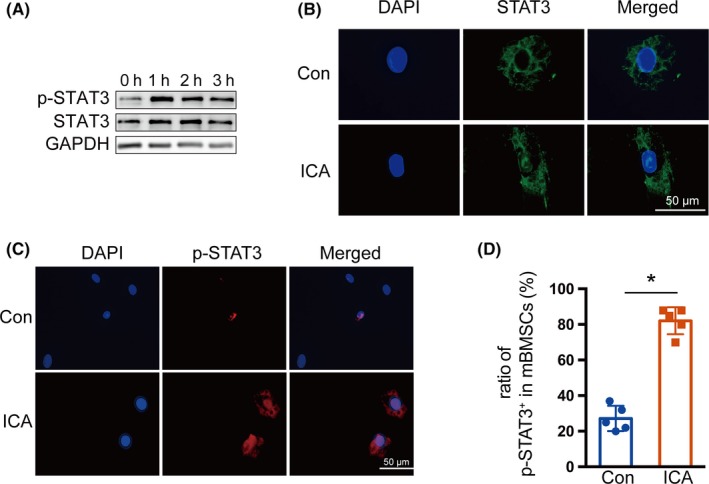
Effects of icariin on STAT3 activity. A, Protein levels of STAT3 and phosphorylation of STAT3 were examined by Western blotting after exposure to icariin (20 μmol/L) at the indicated time points. B, Immunofluorescence staining of STAT3 (green) in control and icariin‐treated mBMSCs for 1 h. C, Immunofluorescence staining of p‐STAT3 (red) in control and icariin‐treated mBMSCs for 1 h. D, The ratio of p‐STAT3+ cells in control and icariin‐treated groups. Error bars represent mean ± SD, *P < .05, n = 3