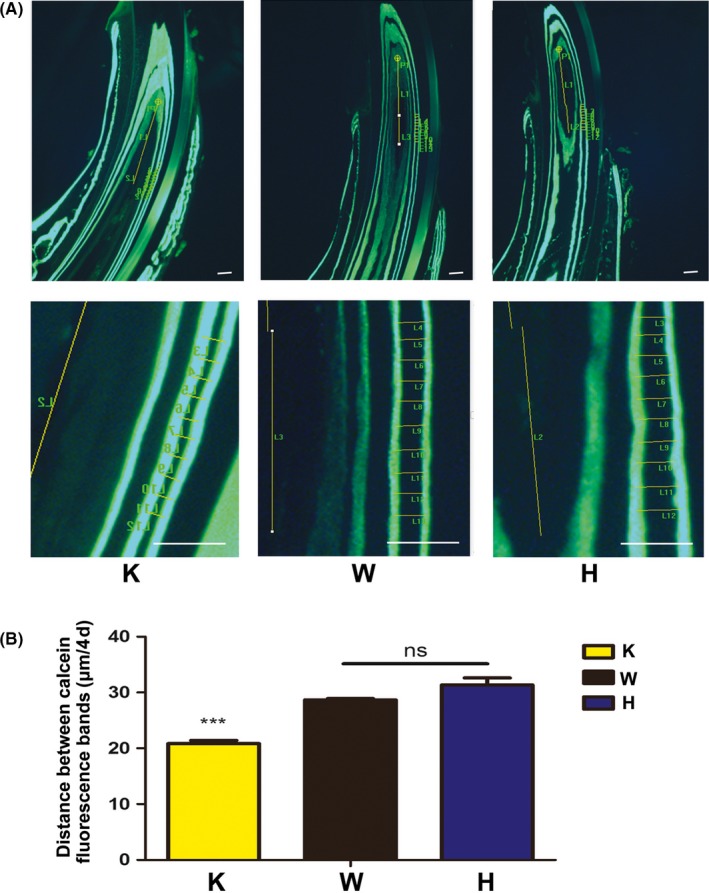
Figure 2.

Results of calcein fluorescence assay. Fluorescence microscopic observation showed that the distance between the calcein fluorescence bands in p75NTR‐knockout mice was distinctly shorter than that in wild‐type and heterozygous mice (A).The distance of every fifth day in p75NTR‐knockout mice was 20.84 μm, which was significantly lower than that of 28.72 μm in wild‐type and 31.60 μm in heterozygous mice (P < .01) (B). No significance was found between wild‐type and heterozygous mice (P > .05). Scale bar represents 50 μm. Abbreviations: H, heterozygous; K, knockout; W, wild type
