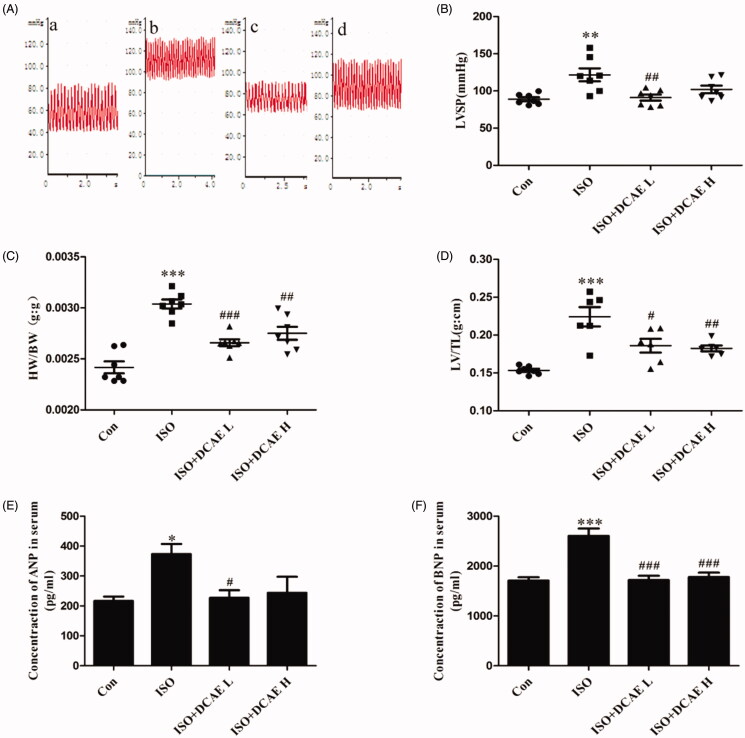
Figure 2.
Effects of DCAE on myocardial injury in rats. (A) Vascular blood pressure measurement in rats (a) Control, (b) Isoproterenol, (c) Isoproterenol + DCAE L, (d) Isoproterenol + DCAE H. (B) Vascular blood pressure summary graph (n = 7). (C) Heart-to-body weight ratio (HW/BW) summary graph (n = 7). (D) Left ventricular weight/tibia length (LV/TL) summary graph (n = 7). (E) Atrial natriuretic peptide (ANP) summary graph. (F) Brain natriuretic peptide (BNP) summary graph. Each value shown represents mean ± SEM (n = 5). *p < 0.05, **p < 0.01, ***p < 0.001 vs. the control group, #p < 0.05, ##p < 0.01, ###p < 0.001 vs. the isoproterenol group.

