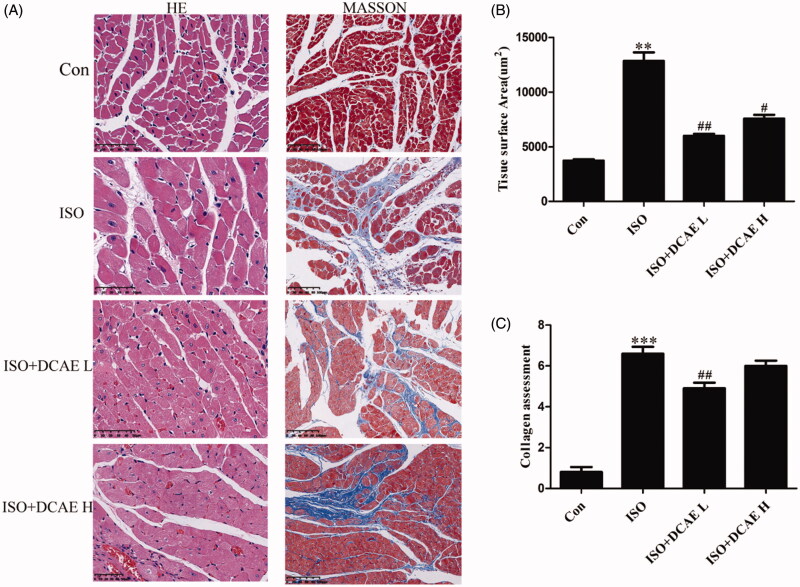
Figure 3.
Effects of DCAE on cardiac hypertrophy and cardiac fibrosis in vivo. (A) HE (scale bar 50 μm) and Masson (scale bar 100 μm) staining of rat cardiac tissue (n = 3). (B) Summary graph of rat myocardial area (n = 3). Each value shown represents mean ± SEM. **p < 0.01, ***p < 0.001 vs. the control group. #p < 0.05, ##p < 0.01 vs. the isoproterenol group.

