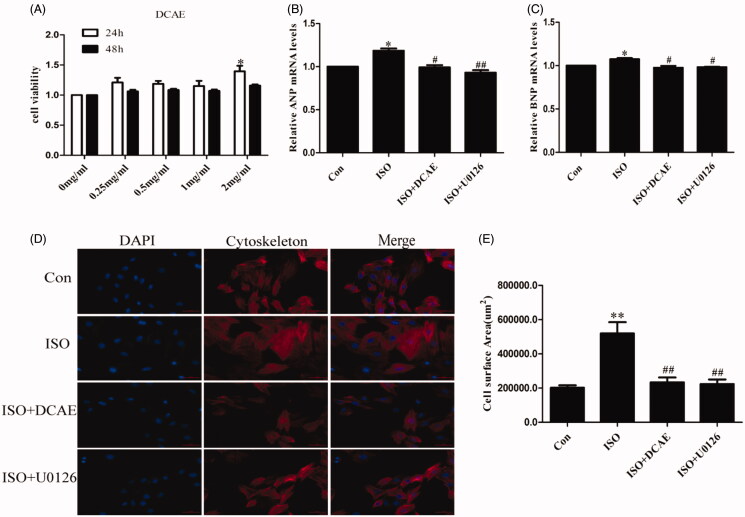
Figure 4.
Effects of DCAE-rich medium on cardiomyocytes hypertrophy induced by isoproterenol in vitro. (A) The effects of different concentrations of DCAE on the activity of H9c2 cells at different times (n = 6). (B) The relative mRNA levels of hypertrophic marker ANP to GAPDH (n = 3). (C) The relative mRNA levels of hypertrophic marker BNP to GAPDH (n = 3). (D) H9c2 cell phalloidin staining (scale bar 100 μm). (E) Summary graph of H9c2 cells area (n = 3). Each value shown represents mean ± SEM. *p < 0.05, **p < 0.01 vs. the control group. #p < 0.05, ##p < 0.01 vs. the isoproterenol group.

