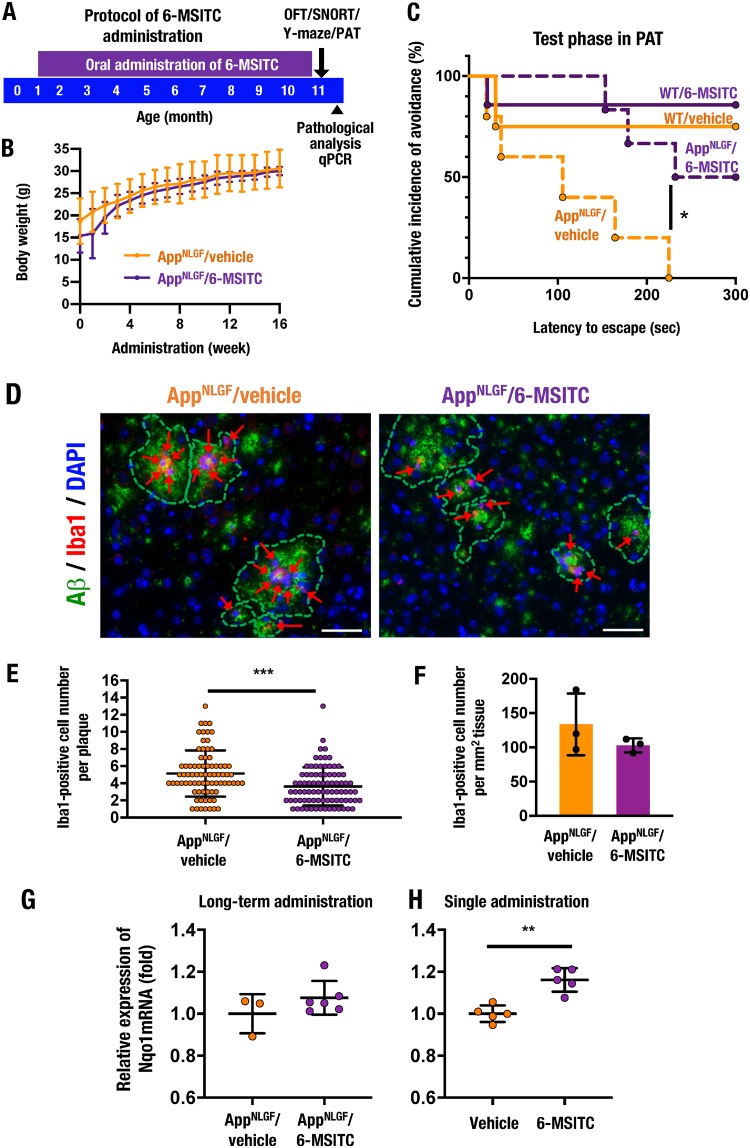
FIG 10.
The Nrf2-inducing natural compound 6-MSITC improves cognitive impairment in AppNLGF mice. (A) A schematic of the protocol for long-term 6-MSITC administration. Vehicle (water) or 6-MSITC was administered to male WT and AppNLGF mice from 1 month of age to 11 months of age through drinking water. Behavior tests, including the OFT, the SNORT, the Y-maze test, and the PAT, were performed at 11 months of age, followed by pathological analysis and quantitative PCR (qPCR). (B) Time course analysis of body weight in AppNLGF mice for 16 weeks during long-term administration of vehicle or 6-MSITC. AppNLGF/vehicle (n = 8) and AppNLGF/6-MSITC (n = 9) mice were analyzed. (C) Results of the PAT in 11-month-old male WT/vehicle (n = 4), WT/6-MITC (n = 7), AppNLGF/vehicle (n = 10), and AppNLGF/6-MSITC (n = 10) mice. The cumulative incidence of avoidance during the test phase is presented. (D) Immunofluorescence staining for Aβ (green) and Iba1 (red) in the cerebral cortices of AppNLGF mice. ARrows indicate Iba1-positive cells around amyloid plaques. Scale bars, 50 μm. (E) The number of Iba1-positive cells in each amyloid plaque. A total of 78 plaques in the cortices from three AppNLGF/vehicle mice and 85 plaques in the cortices of three AppNLGF/6-MSITC mice were counted. (F) Amyloid plaque-associated Iba1-positive cell number per tissue area in the cerebral cortex. Ten images per mouse were counted, and the average of numbers in each mouse was calculated in three each of the AppNLGF/vehicle and AppNLGF/6-MSITC mice. (G) Expression levels of Nqo1 mRNA after long-term oral 6-MSITC administration. The cerebral cortices of 11-month-old male AppNLGF/vehicle (n = 3) and AppNLGF/6-MSITC (n = 6) mice were analyzed. (H) Expression levels of Nqo1 mRNA in the cerebral cortex of 5-week-old male WT mice 12 h after single administration of vehicle or 6-MSITC (50 mg/kg [body weight], intraperitoneally, n = 5 each). Nqo1 expression was normalized to Actb expression, and the levels in vehicle-treated mice were set to 1. The results are presented as means ± the SD (B, E to H) or as a Kaplan-Meier curve (C). Statistical analyses were performed using repeated-measures ANOVA (B), the log rank test (C), or the Student t test (E to H). *, P < 0.05; **, P < 0.01; ***, P < 0.001.

