FIG 7.
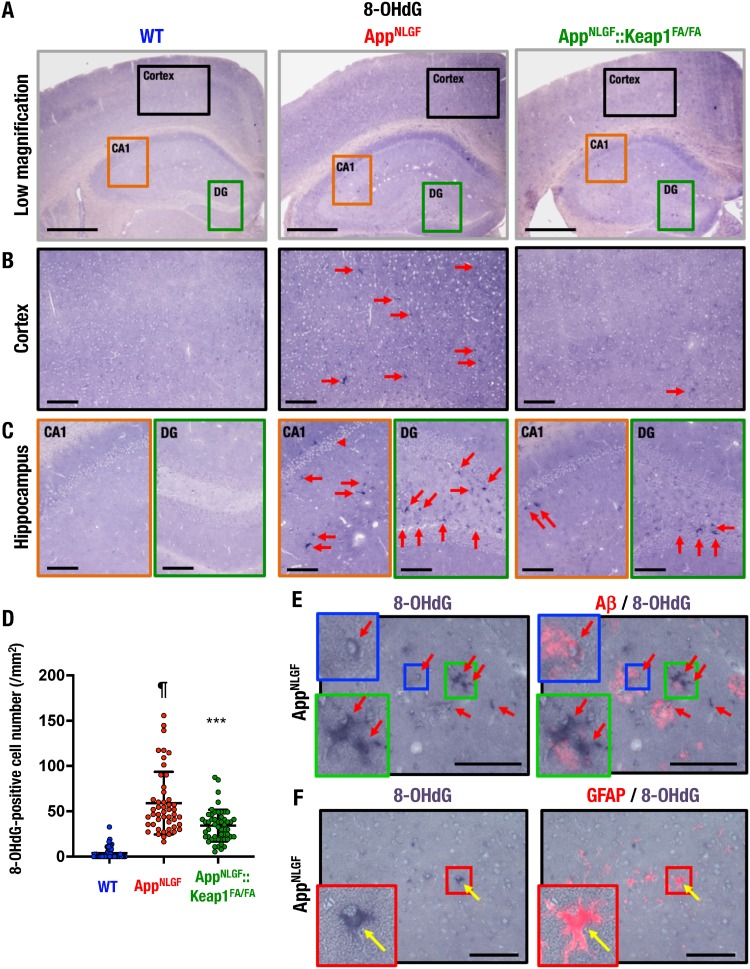
Oxidative stress accumulation in the AppNLGF mouse brain. (A to C) Immunohistochemistry of the oxidative stress marker 8-OHdG. Shown are low-magnification images acquired using a 4× objective (A) and high-magnification images acquired using a 20× objective of the cerebral cortex (B), the hippocampal CA1 (C, left), and the DG (C, right). (D) Number of 8-OHdG-positive cells in the cortex. We analyzed 48, 48, and 52 images from three each WT, AppNLGF, and AppNLGF::Keap1FA/FA mouse cortex. The results are presented as the number per square millimeter of tissue and as means ± the SD. Statistical analyses were performed using ANOVA, followed by the Fisher LSD post hoc test. ¶, P < 0.001 versus WT mice. ***, P < 0.001 versus AppNLGF mice. (E and F) Immunostaining of 8-OHdG and Aβ (E) or GFAP (F) in AppNLGF mouse cerebral cortex. Arrows indicate 8-OHdG-positive cells. Scale bars: 500 μm (A) and 100 μm (B, C, E, and F).

