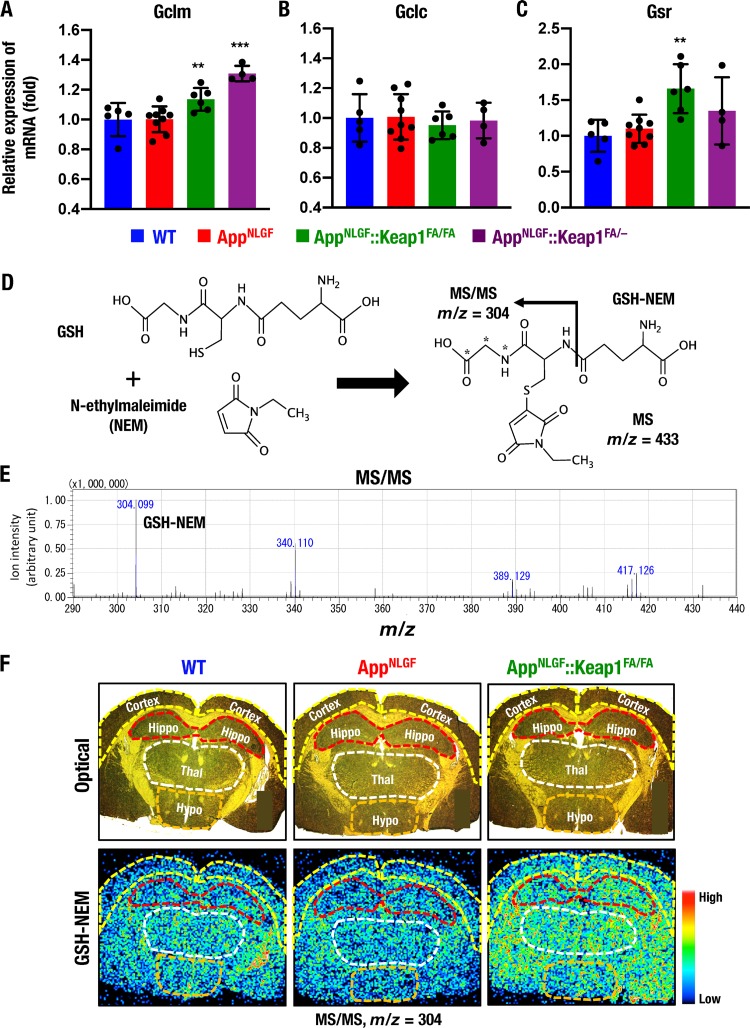
FIG 8.
Nrf2 increases GSH levels in AppNLGF::Keap1FA/FA mouse brains. (A to C) Expression levels of glutathione-related Gclm (A), Gclc (B), and Gsr (C) genes in the cerebral cortex, normalized by Actb gene expression. The expression levels in WT mice were set to 1, and the results are presented as means ± the SD. Note that the Gclm expression levels were significantly elevated in AppNLGF and AppNLGF::Keap1FA/FA mouse brains. Statistical analyses were performed using ANOVA, followed by the Fisher LSD post hoc test. **, P < 0.01; ***, P < 0.001 versus AppNLGF mice. (D to F) MALDI-MSI analysis of GSH in the brain. (D) In the presence of NEM, the thiol residue of GSH conjugates with NEM, and MS/MS signals of GHS-NEM were calculated to be detected as m/z 304. (E) MS/MS signals of GHS-NEM from NEM-treated brain sections were detected as m/z 304.099 by MALDI-MSI analysis. (F) Optical (upper) and MS/MS (lower) images of GHS-NEM signals (m/z 304) in brain sections of 11-month-old male WT, AppNLGF and AppNLGF::Keap1FA/FA mice at positions 8 mm posterior to the bregma. Cortex, cerebral cortex (yellow lines); Hippo, hippocampus (red lines); Thal, thalamus (white line); Hypo, hypothalamus (orange lines).

