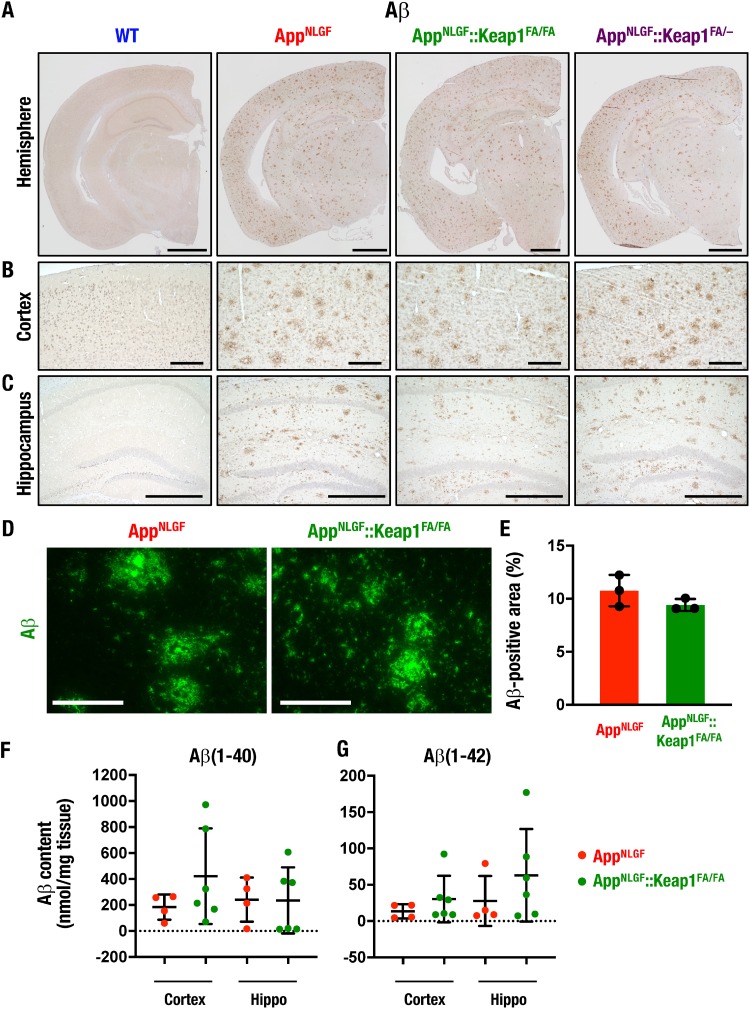
FIG 9.
Nrf2 induction does not significantly change Aβ deposition. (A to C) Immunohistochemistry of Aβ in brain sections as shown in a low-magnification image of the hemisphere (A) and high-magnification images of the cerebral cortex (B) and the hippocampus (C) in 11-month-old WT, AppNLGF, AppNLGF::Keap1FA/FA, and AppNLGF::Keap1FA/– mouse brains. (D and E) Quantification of Aβ accumulation. (D) Aβ immunofluorescence in cortex sections of 11-month-old mouse brains. (E) Nine to eleven cortex images per mouse were analyzed, and the percentage of Aβ-positive area in each mouse cortex was calculated (n = 3). The percentages of Aβ-positive areas of tissue are represented. (F and G) Aβ content in the brain. Soluble Aβ(1-40) (F) and Aβ(1-42) (G) in the cerebral cortex and the hippocampus (Hippo) of four AppNLGF and six AppNLGF::Keap1FA/FA 11-month-old mouse brains are shown. Scale bars: 1 mm (A), 200 μm (B), 500 μm (C), and 100 μm (D). The results are presented as means ± the SD. Statistical analyses were performed using the Mann-Whitney U test (E) or ANOVA, followed by the Fisher LSD post hoc test (F and G).

