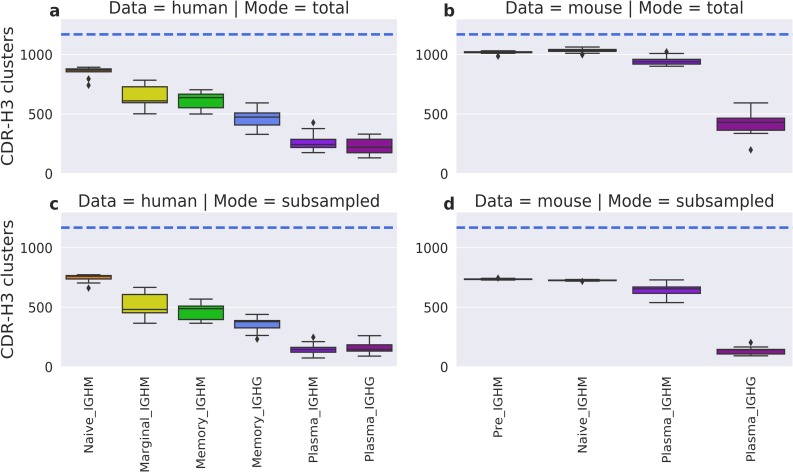
Fig 3. Average number of CDR-H3 clusters in the human and mouse data.
The top boxplots depict the total number of CDR-H3 clusters in human (a) and mouse (b) BCR repertoires. In the bottom boxplots, every human (c) and mouse (d) BCR repertoire was subsampled 100 times for 10,000 sequences, with the average number of CDR-H3 clusters recorded. Colours represent different B-cell types. The horizontal blue line shows the total number of CDR-H3 clusters in our FREAD library, and therefore the theoretical maximum.

