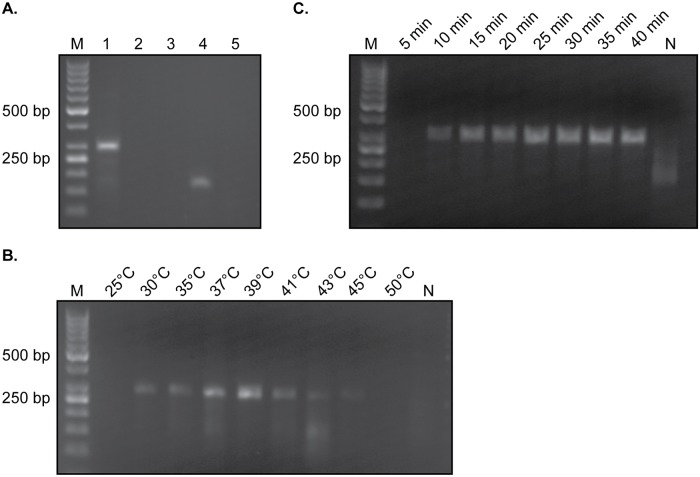
Fig 2. Optimization of the TevRPA.
A: Initial RPA incubated at 37°C for 30 minutes on various samples. Lane 1, T. evansi purified genomic DNA; Lane 2, naïve mouse purified genomic DNA; Lane 3, sample without any template; Lane 4, RPA kit positive control; Lane 5, RPA kit negative control. B: RPA reaction on T. evansi purified genomic DNA incubated at different temperatures for a constant time of 30 minutes. C: RPA reaction on T. evansi purified genomic DNA incubated at a constant temperature of 39°C for various times. In all panels Lane M indicates the molecular mass marker, whereas Lane N in panels B and C represents a negative control sample (no template DNA).

