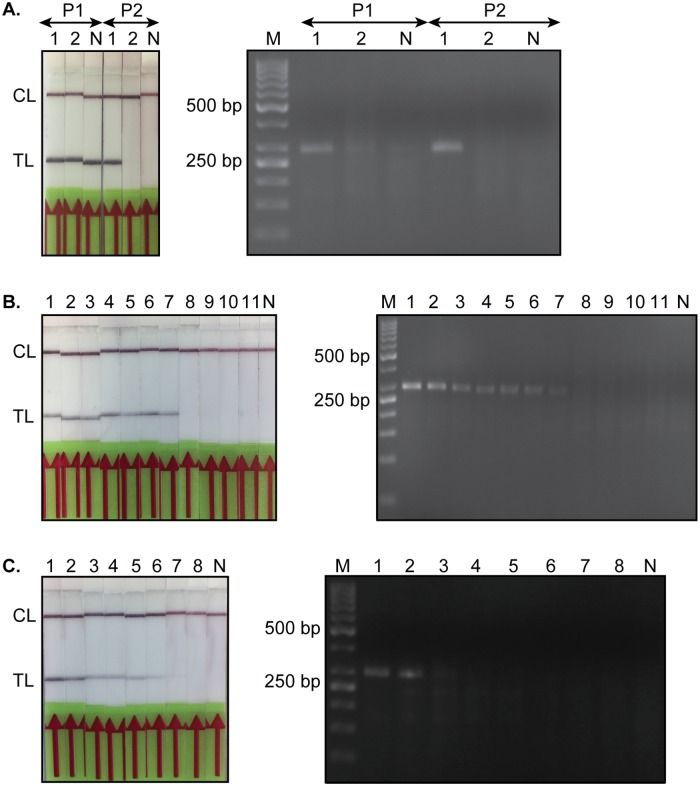
Fig 3. Read-out of the TevRPA via a lateral flow assay (TevRPA-LF) and agarose gel electrophoresis.
A: Selection of a suitable probe for the development of the TevRPA-LF. P1 and P2 refer to FAM probes 1 and 2, respectively. Lane 1, T. evansi purified genomic DNA; Lane 2, naïve mouse purified genomic DNA. B: Assessment of the specificity of the TevRPA-LF. Lanes 1-7, various T. evansi strains as listed in Table 1; Lane 8, T. congolense; Lane 9, T. vivax; Lane 10, T. brucei; Lane 11, L. donovani. C: Comparison of the sensitivities of the TevRPA by a lateral flow assay and agarose gel electrophoresis. Lanes 1-8, 10-fold dilution series of T. evansi purified genomic DNA starting at 10 ng μl−1 (1 μl was loaded onto the gel). Lane 1, 10 ng; Lane 2, 1 ng; Lane 3, 100 pg; Lane 4, 10 pg; Lane 5, 1 pg; Lane 6, 100 fg; Lane 7, 10 fg; Lane 8,1 fg. All panels display the read-out of the TevRPA by a lateral flow assay (left) and agarose gel electrophoresis (right). In all panels Lane M indicates the molecular mass marker, whereas Lane N represents a negative control sample (no template DNA). CL and TL refer to the control and test lines, respectively.

