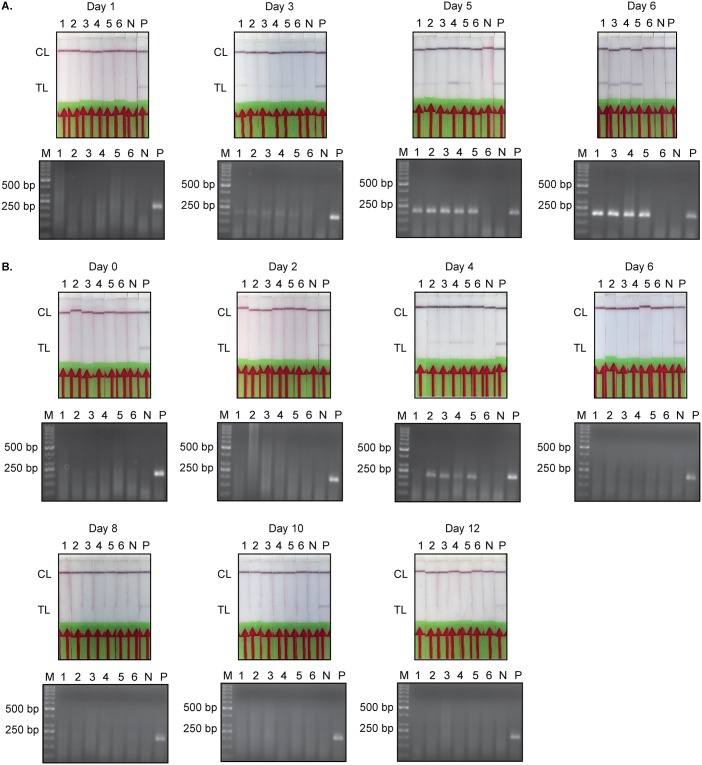
Fig 5. TevPCR and TevRPA-LF read-outs.
The TevPCR (bottom panels) and TevRPA-LF (upper panels) read-outs displayed in Fig 4. A: TevPCR and TevRPA-LF results for the mouse infection trial of Group 1 mice (corresponds to the data set shown in Fig 4A). B: TevPCR and TevRPA-LF results for the mouse infection trial of Group 2 mice (corresponds to the data set shown in Fig 4B). In all panels Lane M indicates the molecular mass marker, Lanes 1-6 indicate the individual mice (mouse 6 was used as a negative control within each data set and was not infected), Lane N is a negative control sample (no template DNA) and Lane P is the positive control (T. evansi purified genomic DNA). CL and TL refer to the control and test lines, respectively.

