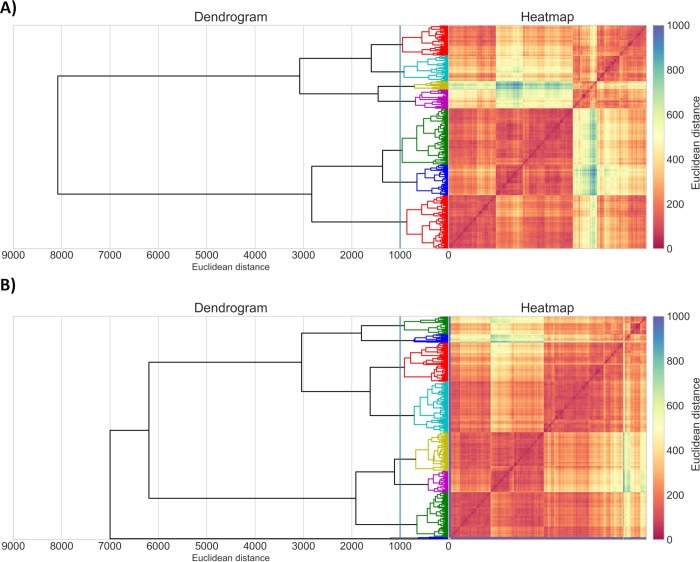
Fig 2.
Cluster analysis of A) 1,162 compounds from P. falciparum dataset and B) 1,270 compounds from cytotoxicity dataset. Dendrogram and heatmap of the distance matrix are both colored according to structural similarity (orange/red = similar; blue/violet = dissimilar). The x- and y-axis labels of the heatmap represent compounds.

