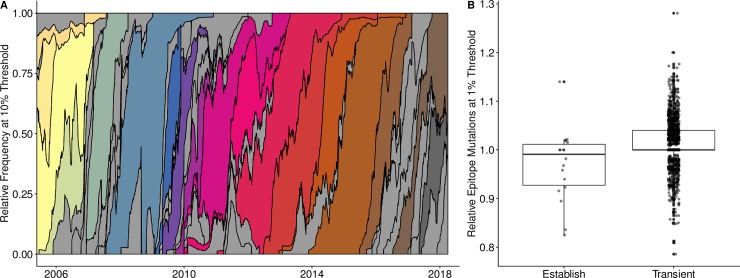
Fig 5. Empirical antigenic dynamics of influenza A/H3N2, 2006–2018.
(A) Relative frequencies of all antigenic clusters that reached the threshold of at least 10% of sampled viruses. Frequencies were calculated using a 60-day sliding window. Grey shading indicates clusters that surpassed the 10% threshold, but did not eventually establish (i.e., reached relative frequency of at least 20% for at least 45 days). Other colors indicate distinct antigenic clusters that eventually established. (B) A low relative number of epitope mutations when a cluster reached the 1% relative frequency threshold was an early indicator of future success (Holm’s P. adjusted, p < 0.003). We divided the number of epitope mutations of a focal cluster by the average number of mutations of simultaneously circulating clusters.

