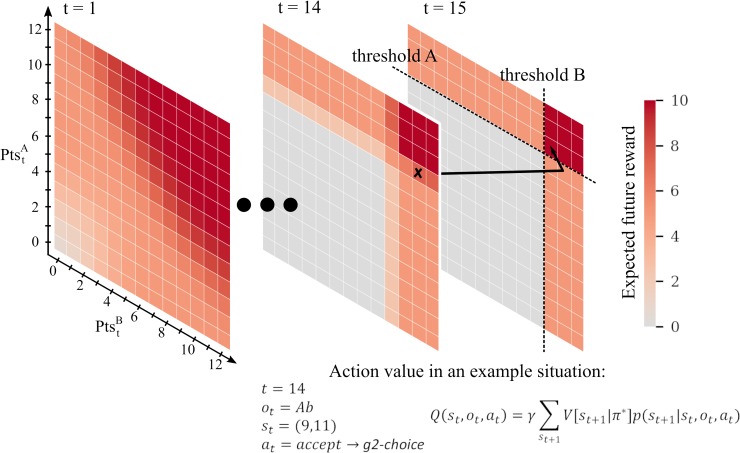
Fig 2. Illustration of the state space and associated expected future reward for the optimal agent (γ = 1, κ = 1).
The black arrow shows a hypothetical transition in the state space. In trial 14 the participant has 9 A-points and 11 B-points (marked by the black cross) and accepts an offer Ab, gaining one A-point and losing one B-point (g2-choice). In the resulting state, both thresholds are reached; thus, the value of that state is 10 Cents. Similarly, the action that leads to that state has an associated Q-value of 10 Cents. In this example the agent would just have to wait in the last trial (15) to gain a 10 cents reward.

